9
STL
+
SUM
DIFF
STEREO FEED
R
L
+
-
+
-
-
R
+
-
L
LOUDNESS MONITOR
MODEL 40-A
-25
-22
-20
-18
-16
-14
-12
-10
- 8
- 6
- 4
- 2
0
+ 2
+ 4
+ 6
+ 8
+10
+12
+14
NORMAL
PEAK
RANGE
NORMAL
RANGE
PERSIS
TENCE
dB
dB
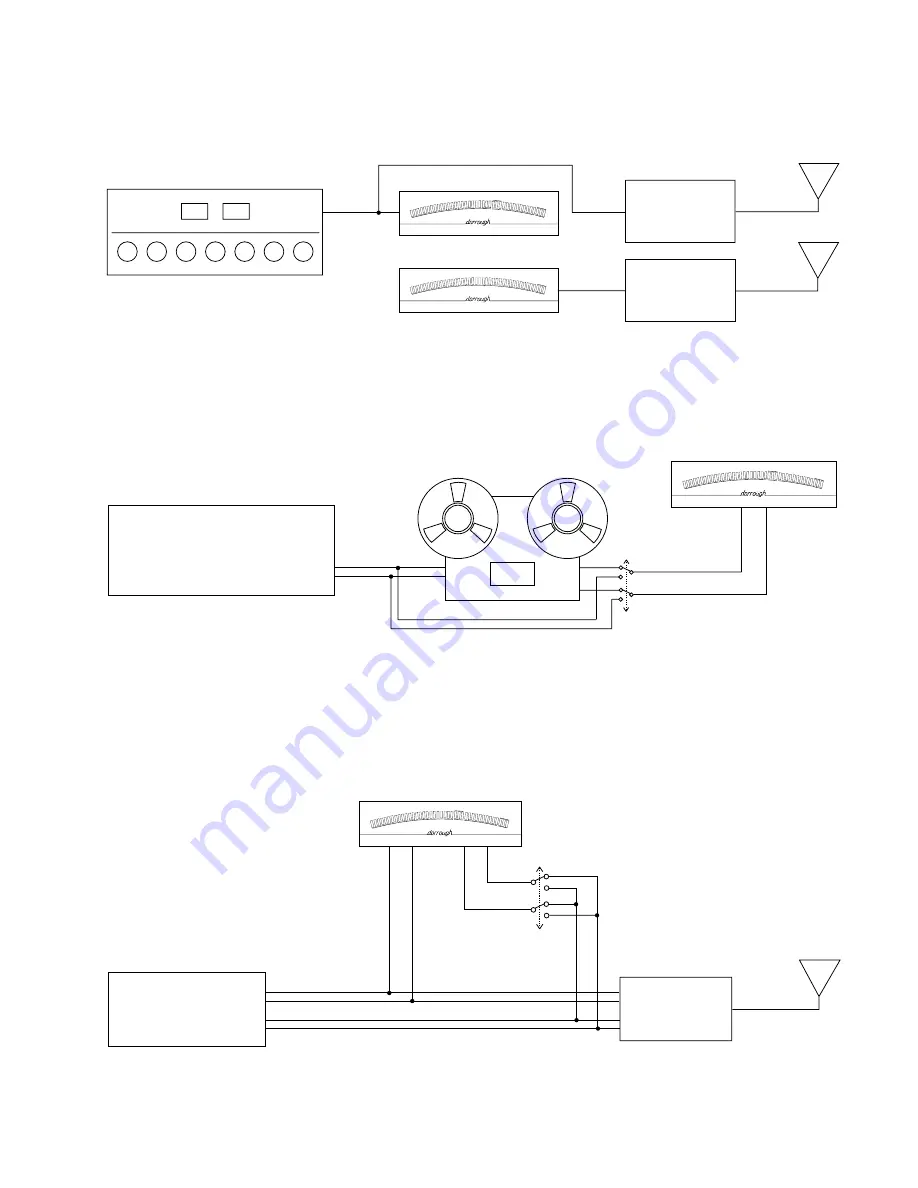
Fig. 10. Sum and Difference Monitor (1 Meter). This interconnect drawing
shows a Sum and Difference Monitor setup by utilizing a single "A" or "B"
Type DORROUGH Loudess Monitor.
Fig. 8. Broadcast Monaural Applications. This line drawing shows a typical
broadcast application. Most stations use an "A" Type DORROUGH
Loudness Monitor to monitor the "unprocessed" Transmitter signal and
either an "A" or B" Type DORROUGH Loudness Monitor to verify the Off-Air
signals in real time. The "B" Type Monitor is the preferred instrument for
verifying peak headroom.
Fig. 9. Analog/Digital Tape Saturation Monitor. This interconnect drawing
shows an example of monitoring tape saturation by comparing pre- and post-
tape signal levels. Once saturation is reached, the post-tape readings will no
longer track increases in pre-tape signal levels. NOTE: This example
assumes the tape deck is aligned for unity gain. Although a "B" Type
DORROUGH Loudness Monitor is preferred, an "A" Type is acceptable.
AUDIO FEED
FROM CONSOLE
POST
PRE
+
-
+
-
+
-
LOUDNESS MONITOR
MODEL 40-A
-25
-22
-20
-18
-16
-14
-12
-10
- 8
- 6
- 4
- 2
0
+ 2
+ 4
+ 6
+ 8
+10
+12
+14
NORMAL
PEAK
RANGE
NORMAL
RANGE
PERSIS
TENCE
dB
dB
TRANSMITTER
LOUDNESS MONITOR
MODEL 40-A
-25
-22
-20
-18
-16
-14
-12
-10
- 8
- 6
- 4
- 2
0
+ 2
+ 4
+ 6
+ 8
+10
+12
+14
NORMAL
PEAK
RANGE
NORMAL
RANGE
PERSIS
TENCE
dB
dB
"A" TYPE
RELATIVE LOUDNESS TO PEAK MODULATION
MODEL 40-B
dB
dB
-36
1.6
-34
-32
-30
-28
-26
-24
-22
-20
-18
-16
-14
-12
-10
- 8
- 6
- 4
- 2
0 +1 +2
+3
2
2.5
3.2
4
5
6.3
8
10
12
16
20
25
32
40
50
63
80
100
125
% MODU
LATION
% MODU
LATION
"B" TYPE
MODULATION
MONITOR
Summary of Contents for 10-A
Page 19: ...18 NOTES ...


