11
90
0
-90
º
º
º
0 5 10 15 20 25 30 35 40 45 50 kHz
Phase
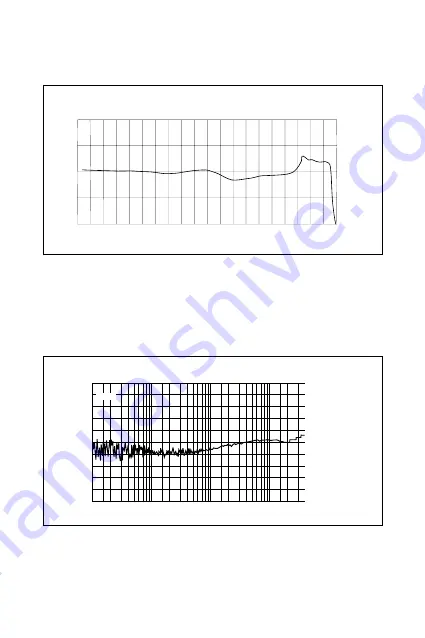
Fig. 1. On-axis amplitude and phase responses of DPA 400, 4006 and 4006-TL
plotting using a linear frequency axis for evaluation of the phase response.
200 Hz
2 kHz
20 kHz
0
30
20
10
-10
-20
dB SPL
Fig. 1. Typical third-octave inherent-noise spectrum of DPA 400, 4006 and
4006-TL.
Summary of Contents for 4003
Page 2: ... ...


