23
3.3
Set Gauge Min/Max Values
The DashDAQ allows users to specify the data
range for each gauge. Tap on the [Minimum] button
to set the bottom value for a gauge. Tap on the
[Maximum] button to set the top of the gauge.
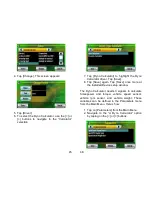
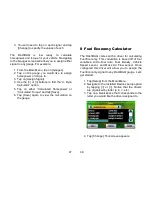
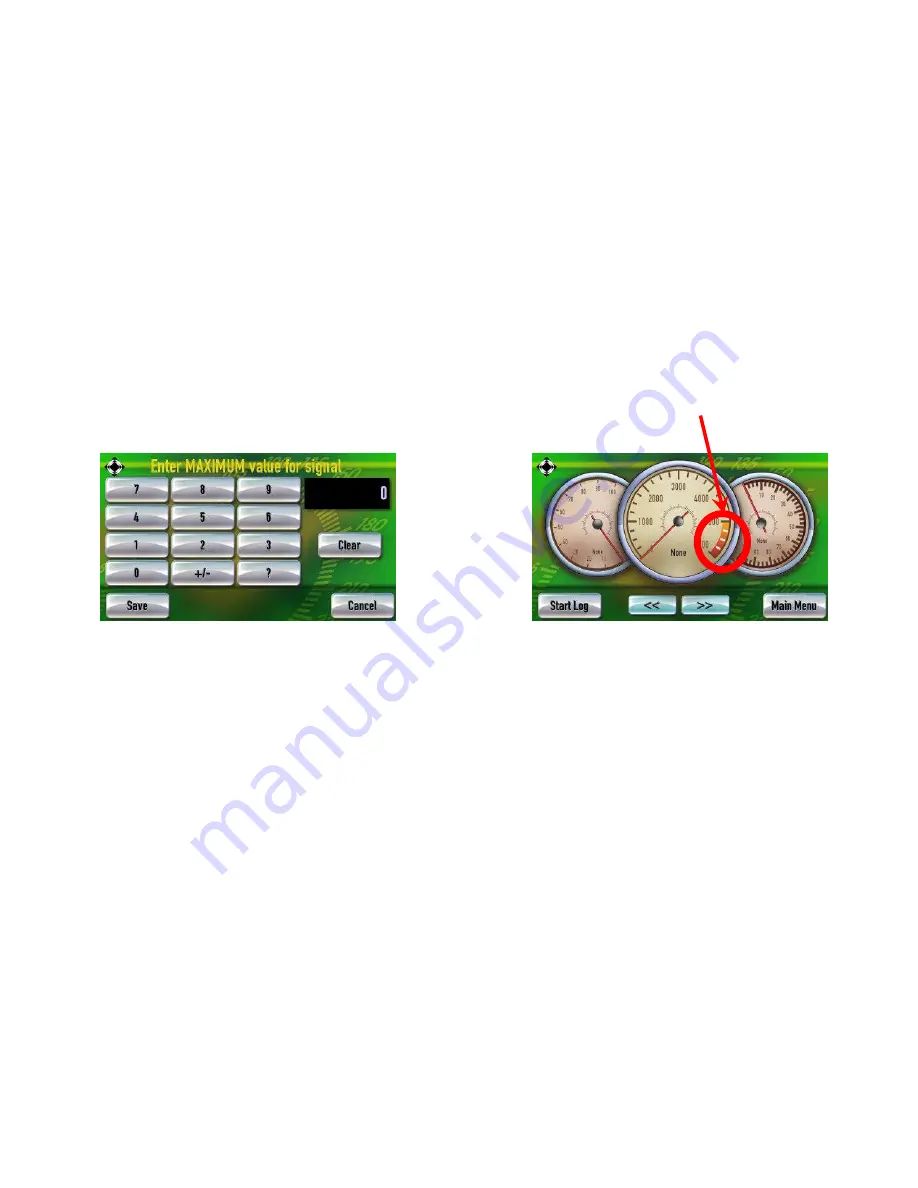
When you tap on either [Minimum] or [Maximum]
this screen will appear:
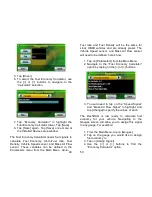
Tap in the desired value. Tap [+/-] to make this
value negative.
24
3.4
Set Gauge High/Low Warning
The High/Low Warning allows users to set the
visual representation of “redline” on a gauge.
For example: If the gauge has a maximum value of
6,000 and you set a High Warning of 5,000, the
gauge will visually represent a “danger zone” on
the gauge.
To set a High/Low Warning:
1. Tap on the gauge that a High/Low Warning is
to be set.
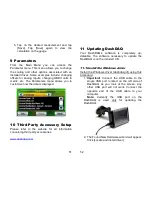
2. At the Assign Signal screen, tap on either
High or Low Warning.
3. Tap the numbers to enter the desired value.
Tap [+/-] to make the value negative. Tap
[Save].
4. Tape [Save] at the Assign Signal screen to
go back to the gauges.
3.5
Setting Signal/Graph Colors
Summary of Contents for DashDAQ Series II
Page 31: ...61...


