Operator Manual, Dual-Column Cloud Condensation Nuclei Counter (CCN-200)
DOC-0128 Rev F
4 3
© 2017 DROPLET MEASUREMENT TECHNOLOGIES
7)
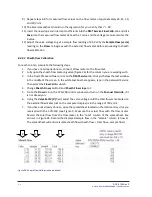
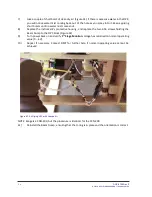
Measure the actual flow with the flow meter. Record the flow from the flow meter in the
flow column of the spreadsheet. The spreadsheet is located on the USB memory stick you
received with the CCN-200 (Figure 3).
8)
Record the value displayed in the
Sample Flow (Vccm)
field in the volts column. (Because
Step #4 sets the regression coefficients to 1 and 0, the
Sample Flow (Vccm)
indicator is now
actually displaying the
voltage
from the sample flow differential pressure transducer.) This
value typically ranges from 2.3 to 4.0 V. Do not record the
Valve Set M (V)
value for use in
the regression. (You can record it for informational purposes, if you want to remember which
settings are used to achieve specific flow rates.)
Figure 27: Entering Values in the Calibration Spreadsheet for Regression Analysis

