DOC-0128 Rev F
© 2017 DROPLET MEASUREMENT TECHNOLOGIES
6
F i g u r e s
Figure 4: SS Tab with Dry Start Up and Dry Shut Down Buttons Active ............................ 12
Figure 10: Supersaturation Being Generated in the CCN Column .......................................
Figure 11: Side View of CCN with Important Components Labeled.................................. 24
Figure 18: Location of Power, Communications, Sample and Exhaust Connections ......... 32
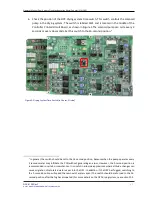
Figure 19: Power Supply and Controller Boards with Important LEDs Identified .............. 34
Figure 21: Power Supply Boards for TEC Current Control Module, with LED Circled ......... 36
Figure 27: Entering Values in the Calibration Spreadsheet for Regression Analysis ......... 43
Figure 30: Column A’s Beam Dump and Set Screws. Column B has an Identical OPC. ...... 47

