Operator Manual, Dual-Column Cloud Condensation Nuclei Counter (CCN-200)
DOC-0128 Rev F
7 7
© 2017 DROPLET MEASUREMENT TECHNOLOGIES
The
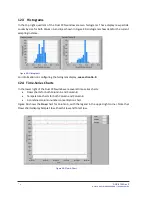
Temperature Chart
plots the temperatures of various CCN components over time. See section 0
for details and the normal range for these temperatures. The Temperature Chart also indicates the
temperature of the sample air.
For information on configuring the chart display, see section 16.0.
12.5
Serial Output Tab
Next to the time-series charts is the
Serial Output
tab. This tab enables users to specify how they
would like the CCN-200 to handle serial data output. There are three options:
1)
The instrument generates no serial output.
2)
The instrument generates a normal stream of serial output.
Note: This option must be used to
interface with the Particle Analysis and Display System (PADS), if you own it.
3)
The instrument generates a user-defined stream of serial output.
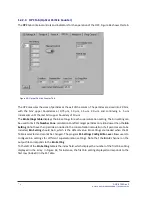
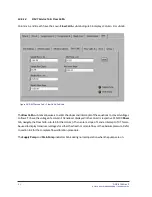
These options are described in more detail below. The radio buttons in the upper left of the
Serial
Output
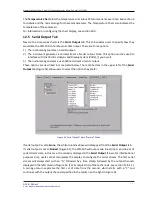
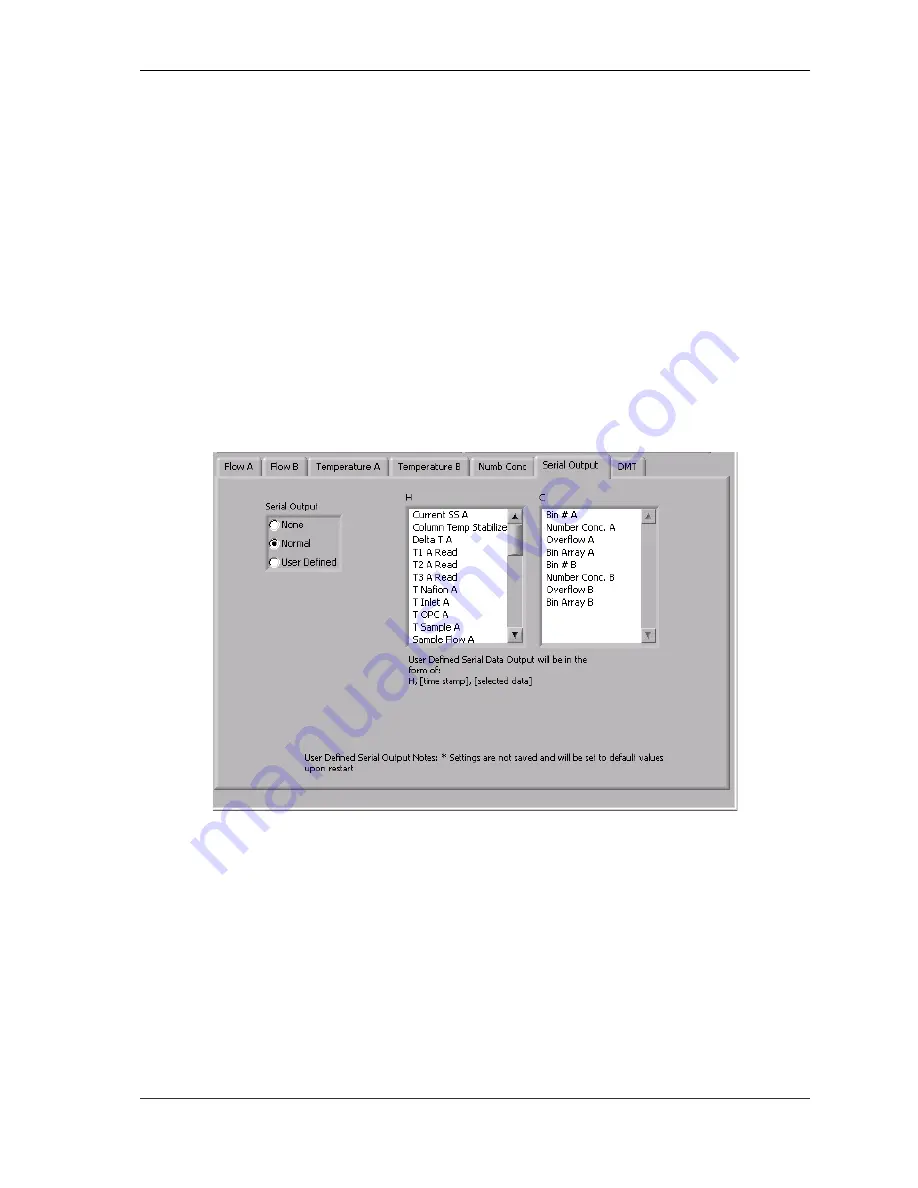
tab (Figure 51) allow users to select the option they prefer.
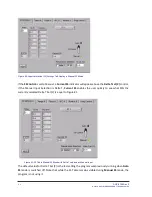
Figure 51: Serial Output Tab in "Normal" Mode
If serial output is set to
None
, the white columns above will disappear from the
Serial Output
tab.
If serial output is set to
Normal
(Figure 51), the CCN-200 will output two lines (Line H and Line C) of
serial stream data. In this case, the columns displayed in the
Serial Output
tab are for informational
purposes only; users cannot manipulate the display to configure the serial stream. The first serial
stream will always start with an “H,” followed by a time stamp, followed by the output channels
displayed in the left column of Figure 51. (For a complete list of these channels, see section 12.8.1.1.)
A carriage return separates the first set of data from the second, which starts with a “C” and
continues with the output channels specified in the column on the right in Figure 51.

