DOC-0128 Rev F
© 2017 DROPLET MEASUREMENT TECHNOLOGIES
9 6
15.2
Selectable Chart Options
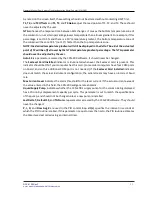
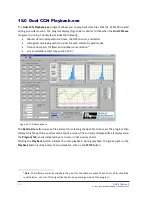
You can configure the Selectable Chart using the control panel in the bottom left of the window
(Figure 66). These controls determine the channels to display. The default channels are the
temperature values charted with respect to time.
16.0
Chart Options (for Dual CCN.exe and CCN
Playback.exe Programs)
In both the
Dual CCN.exe
and
Dual CCN
Playback.exe
programs, you can right-click on charts such as
the histogram and time-series charts to bring up additional options.
On many charts, you can change the scale by typing a different number into the starting and ending
values on each axis. For instance, if you want to change the time period in one of the graphs above
to end at an earlier time, you simply select the field with the old time, type in the new time, and hit
the <Enter> key. In acquisition mode, you must disable autoscaling (see below) before you modify
fields in this way. Many charts also display options for scaling and copying the data when you right-
click on them, which brings up a drop-down menu. These options are as follows:
Autoscale -
This autoscales the relevant axis. In autoscaling mode, the minimum and
maximum values of the axis are set automatically all data points can be seen in the display.
Copy Data -
This copies the chart to the clipboard using a screen capture. This chart can then
be pasted into other documents like Word or PowerPoint presentations.
Export Simplified Image -
This copies a simplified image of the data to the clipboard or an
output file. You can choose the format you desire—bitmap (.bmp), encapsulated postscript
(.eps), or enhanced metafile (.emf). Note that when you select the .eps option, you must
copy the data to a file. Unless you specify otherwise, output files will be saved in the time-
and-date-specific output file directory for the current session.
Clear Graph -
This erases the currently displayed data points from the graph.
Figure 66: Selectable Chart Control Panel

