DOC-0425 Rev D
© 2019 DROPLET MEASUREMENT TECHNOLOGIES LLC
2 6
1.14
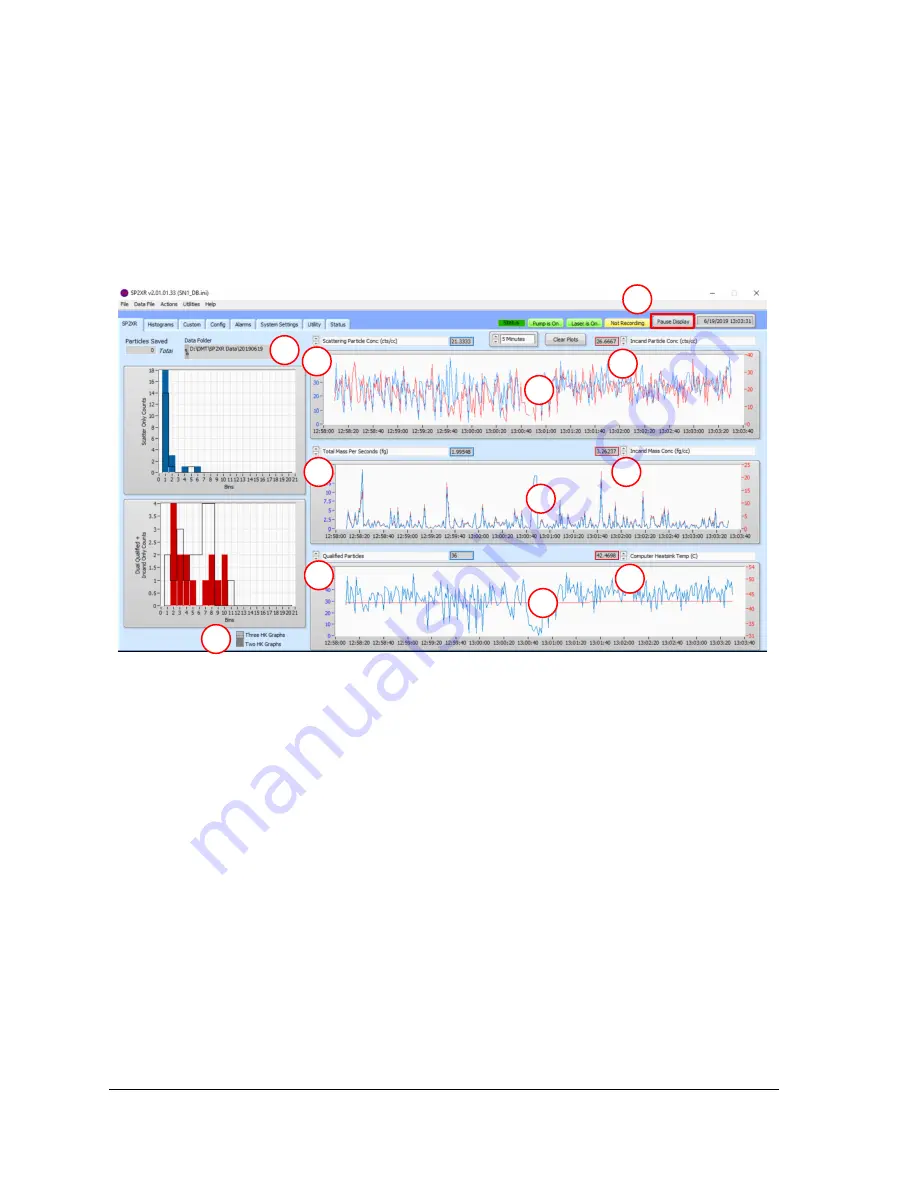
SP2-XR Main Screen
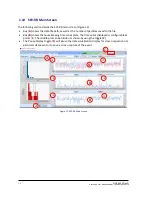
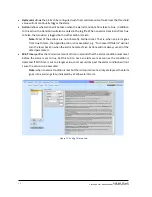
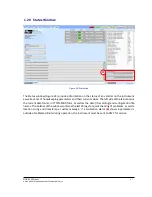
The following section details the SP2-XR main screen (Figure 12).
•
Box
(
A
)
shows the data file path, as well as the number of particles saved to the file.
•
Box
(
B
)
shows the housekeeping time series plots. The time series displayed is configurable at
points
(
1
)
. The middle plot can be hidden or shown by using the toggle
(
2
)
.
•
The Pause Display toggle
(
C
)
will pause the data visualization display for closer inspection of a
particular data event or to save a screen capture of the event.
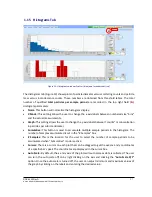
Figure 12: SP2-XR Main Screen
A
0
B
0
C
0
1
0
1
0
1
0
1
0
1
0
1
0
2
0
B
0
B
0

