Manual, Ultra High Sensitivity Aerosol Spectrometer (UHSAS)
DOC-0210 Rev E-4
5 2
© 2017 DROPLET MEASUREMENT TECHNOLOGIES
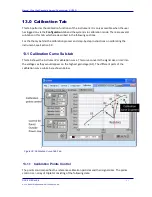
1.)
Gain
, the gain stage on which the particle signal appears
2.)
mV
, the signal size in mV of the particle signal
3.)
nm
, the size of the particle in nm.
The
Points
field lists the element in the array that is currently being displayed. The array begins
with element zero. In Figure 30, the Calibration Points control is displaying element (point) zero.
The number of reference particles determines the length of the array. At least one point needs
to be specified to calibrate the unit. This is normally the NIST 100 nm SRM, which appears as
~4000 mV on G3. Any number of reference particles can be used to calibrate the instrument. For
instructions on how to measure particles and enter calibration points see Section 5.0. The cal-
curve will be interpolated between reference points in log-log space.
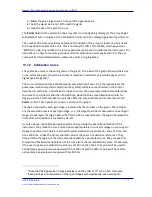
13.1.2 Calibration Curve
The calibration curve is shown in green on the graph. The x-axis of the graph shows particle size
in nm, while the y-axis shows the instrument response in millivolts as it would appear on the
highest gain stage (G3).
2
The curve is determined by both theoretical and empirical means. On a theoretical level, the
power-law relationship (hard-coded into the system) and Mie curve (entered in the control
described in section 13.1.3) determine the basic curve. The power-law relationship determines
the curve for particles smaller than 200-300 nm, while the Mie curve determines points for
larger particles. This theoretical curve is then fitted to empirical data points entered into the
Points
control. These points are shown in white on the graph.
The region covered by each gain stage is indicated by the red dots on the graph. The red dots
are the saturation levels of each gain stage—i.e., the largest particles measureable on each gain
stage. For example, the region below the first red dot is covered by G3, the region between the
first and second red dots is covered by G2, etc.
As noted above, the calibration points (white dots) provide the absolute calibration of the
instrument: they move the curve up and down appropriately to convert voltage on various gain
stages to particle size. There are two white points fixed by the instrument—one at 10 nm, and
one at 300 nm. Unlike the other calibration points, these are not absolute references. They
simply define the region of the instrument described by a power-law curve. They are used for
forward and backward extrapolation of the curve from the real calibration points. For example,
if the user supplies one calibration point, say at 100 nm, then the 10 nm point will be used to
extrapolate a power-law curve downward from 100 nm and the 300 nm point will be used to
extrapolate a power-law curve upward from 100 nm.
2
Note that the signal size of large particles is on the order of 10
6
mV on G3. Of course,
these particles are measured on other gain stages with significantly less overall gain.

