Manual, Ultra High Sensitivity Aerosol Spectrometer (UHSAS)
DOC-0210 Rev E-4
5 1
© 2017 DROPLET MEASUREMENT TECHNOLOGIES
13.0
Calibration Tab
This tab performs the calibration functions of the instrument. It is only accessible when the user
has logged on via the
Configuration
tab and the system is in calibration mode. There are several
sub-tabs on this tab, which are described in the following sections.
For the theory behind the calibration process and step-by-step instructions on calibrating the
instrument, see Section 5.0.
13.1 Calibration Curve Sub-tab
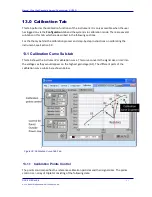
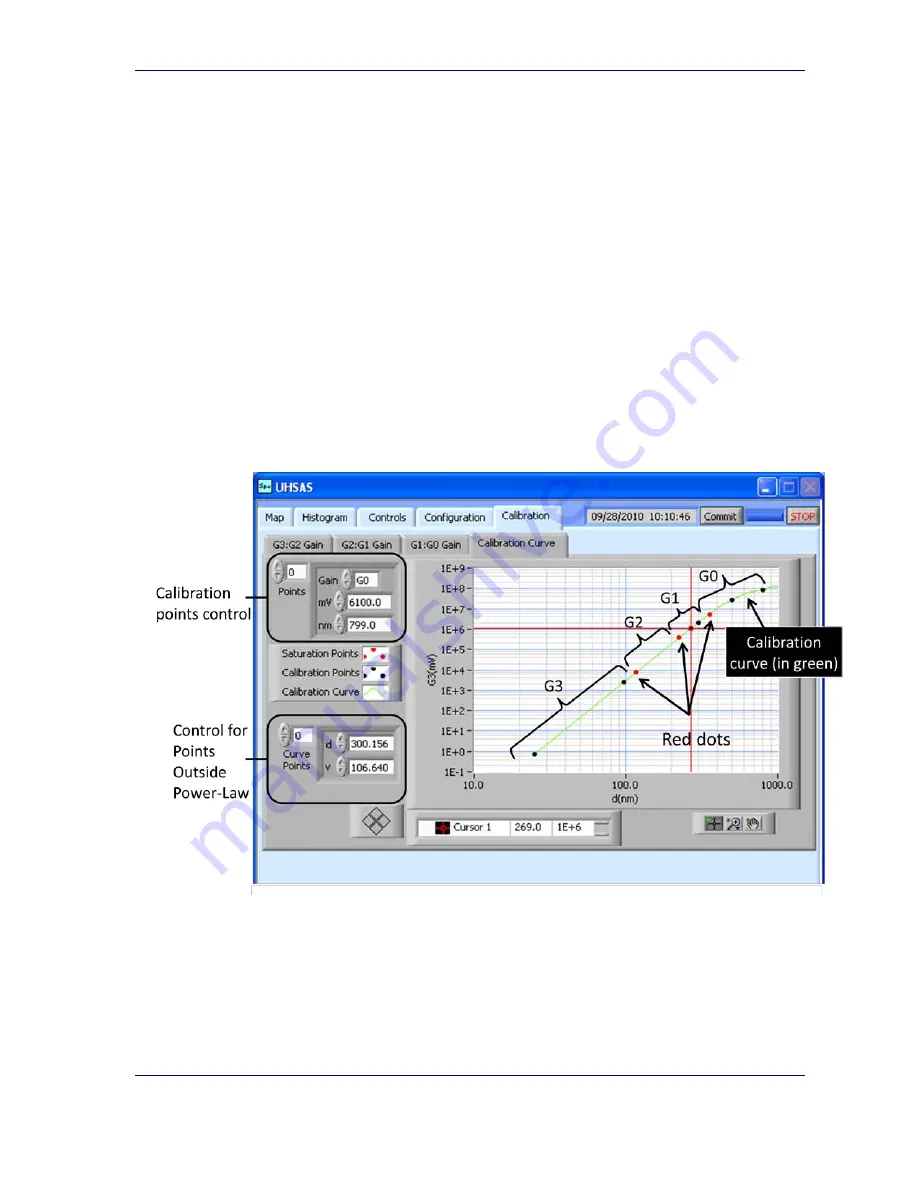
This tab shows the instrument’s calibration curve. This curve converts the signal sizes in mV into
the voltages as they would appear on the highest gain stage (G3). The different parts of the
calibration curve sub-tab are shown below.
13.1.1 Calibration Points Control
The points control specifies the reference calibration particles and their signal sizes. The points
control is an array of triplets consisting of the following data:
Figure 30: Calibration Curve Sub-Tab

