Manual, Ultra High Sensitivity Aerosol Spectrometer (UHSAS)
DOC-0210 Rev E-4
5 3
© 2017 DROPLET MEASUREMENT TECHNOLOGIES
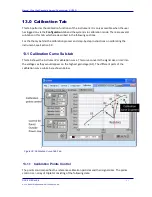
The red cursor can be moved to see specific x and y coordinates on the curve. These appear as
numeric values in the white field beneath the graph.
13.1.3 Control for Points Outside the Power-Law
Above 300 nm, the calibration curve is defined by the calibration points specified in the lower
left-hand corner of the screen. This is an array of points which specifies the relative signal size of
particles above 300 nm. It is used to specify the
shape
of the calibration curve outside of the
power-law response region. More precisely, it specifies the Mie curve of signal size (v) versus
particle diameter (d) on the lowest gain channel (G0). The diameters specified are absolute in
nm, and the signal size is specified as a relative number. This is the only gain stage that can be
set to something other than a 6
th
power law.
The
Curve Points
field lists the element in the array that is currently being displayed. The array
begins with element zero. In Figure 30, the control is displaying element (point) zero.
13.2
G3:G2 Gain, G2:G1 Gain, G1:G0 Gain (the Relative-Gain
Sub-tabs)
These tabs are used to perform gain-ratio operations. The graphs show the gain and offset
calculated from the sampled data points (Figure 31). This gain and offset, along with the
calibration points, are then used during bin-map commitment to provide a seamless transition
between gain stages.

