Leaders in Pipelin
e Survey Systems
C
C
C
-
-
-
S
S
S
C
C
C
A
A
A
N
N
N
2
2
2
0
0
0
1
1
1
0
0
0
SYSTEM MANUAL Version 6.03i
47
7. SURVEY PLANNING AND INTERPRETATION OF RESULTS
7.1. Distance Between Survey Points
When carrying out a survey, the distance between survey points is one of the decisions
that the Surveyor will have to make. The optimum distance between readings will depend
on two main factors: the general quality of the line and the minimum size of anomaly that is
likely to require accurate location for excavation, investigation and repair. On a pipeline
that has not been surveyed with a C-SCAN system before, it is important that the distance
between readings is short, so that all anomalies can be captured – this is where the
baseline survey is recommended. But for future surveys the distance between readings
will be decided in part by the results of the baseline survey. If the results show an
excellent coating with consistently low attenuation figures, then future surveys can be
carried out with a greater spacing between points. If the results show a coating in poor
condition with high attenuations, then it may be decided to either repair the damaged
coating or continue to survey but instead concentrate on single ‘point’ faults where
attenuations are significantly higher that the baseline reading.
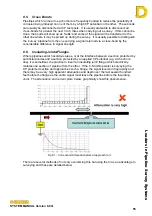
However, it must be remembered that while a single small fault may raise the attenuation
levels by a noticeable amount when readings are taken at the baseline 300ft intervals, this
same fault may not raise attenuation levels enough to be noticed when readings are taken
at greater intervals, e.g. 3000ft. So the distance between survey points may need to be
adjusted depending on the level of detail that is required.
7.2. Attenuation Values
Attenuation figures measure the logarithmic rate of decline of the applied current, per
metre length of the pipeline. The unit is millibels per metre (mB/m), even when using
imperial measurements. Typical attenuation values for well protected lines of various
sizes are*:
6” Pipeline
Less than
0.4mB/m
Excellent coating
0.4mB/m to
1mB/m
Good to fair coating
1mB/m to
5mB/m
Fair to bad coating
Above
5mB/m
Bad to no coating
12” Pipeline
Less than
0.5mB/m
Excellent coating
0.5mB/m to
1.5mB/m
Good to fair coating
1.5mB/m to
6mB/m
Fair to bad coating
Above
6mB/m
Bad to no coating
24” Pipeline
Less than
0.6mB/m
Excellent coating
0.6mB/m to
1.8mB/m
Good to fair coating
1.8mB/m to
8.0mB/m
Fair to bad coating
Above
8.0mB/m
Bad to no coating
36” Pipeline
Less than
0.7mB/m
Excellent coating
0.7mB/m to
2.0mB/m
Good to fair coating
2.0mB/m to
9.5mB/m
Fair to bad coating
Above
9.5mB/m
Bad to no coating
*Figures based on Coal Tar/Bitumen coating.
Coating type can be chosen in DCAPP
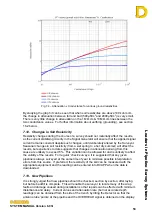
There is a maximum attenuation that can be observed, and this occurs when all coating
has been lost (bare pipe). In this situation, the maximum attenuation is limited by soil
resistivity. The graph below shows these limits:


