Leaders in Pipelin
e Survey Systems
C
C
C
-
-
-
S
S
S
C
C
C
A
A
A
N
N
N
2
2
2
0
0
0
1
1
1
0
0
0
SYSTEM MANUAL Version 6.03i
65
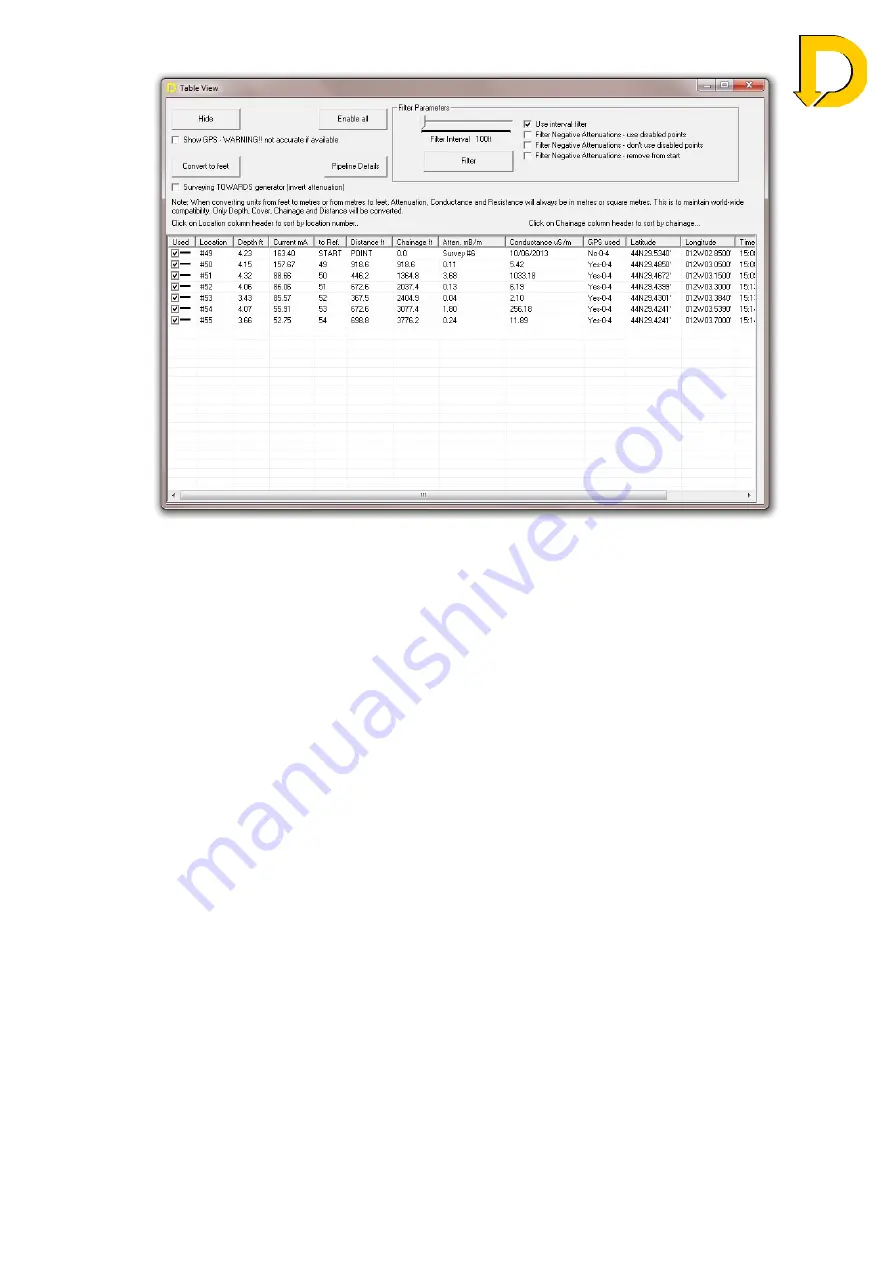
Fig 11.4 – Table view
Summary of options in Table View:
Hide -
Hide
Table
View
Enable All
- Re-enable all suppressed points
Convert to Feet
- Convert to decimal feet or feet and inches
Pipeline Details
- Opens the Survey Details box
Surveying TOWARDS
Generator
- If a survey has been taken towards the Generator the
entire survey can be reversed to display a decreasing
current (positive attenuations)
Filter Parameters
Filter
- Once the filter parameters listed below have been
chosen, select to apply the filter
Filter Interval
- If there is a large amount of data, this can be filtered at a
predetermined interval e.g. 25m. Adjust the slide to
increase or decrease the filter distance. This can be
useful if data points were taken at narrow intervals for
depth-of-cover surveys, but such close intervals are not
good for attenuation surveys. By filtering the data at
greater intervals means the data from a single survey
can be analysed for both depth of cover and attenuation
Use Interval Filter
- Select to apply the Filter Interval distance chosen above
Filter Negative Attenuations - Negative attenuations can appear during a survey for a
number of reasons; starting too close to the Signal
Generator, currents from a similar source entering the
pipeline or simply an erroneous survey point. DCAPP
allows the user to manually disable these points or use
the Filter Function to automatically suppress these
negative values. When the Filter Negative Attenuations


