background image

Leaders in Pipelin

e Survey Systems


C

C

C

-

-

-

S

S

S

C

C

C

A

A

A

N

N

N


2

2

2

0

0

0

1

1

1

0

0

0


SYSTEM MANUAL Version 6.03i 

28 

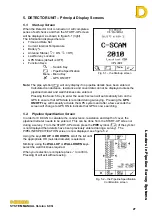
Fig. 5.2 – the Pipeline 

Specification screen

A final confirmation screen will confirm your selection 
(Fig. 5.3).  If correct, select the   key again to continue.  
If further editing of the specification is required, press 
the 

³

 key to return to the PIPELINE SPECIFICATION 

screen. 

Notes:

 Wall thickness may not be known, in which 

case select the “???

 option.  Calculation of 

conductance will then change slightly as an 
average will be taken.  The resulting error will 
not be significant. 

Once the data has been downloaded to DCAPP, any 
size of Pipeline and Wall Thickness can be entered, so 
if the Pipeline Diameter or Wall Thickness required is 
not listed, choose the closest size and enter the correct 
data in DCAPP.   

Once the pipeline specification has been entered and accepted, the system returns to the 
START-UP Screen.  As pipeline specification details have been entered, the 

SEARCH


symbol (

) will be flashing, indicating that the instrument is ready to start a survey.  To 

start a survey, select 

SEARCH

.   

5.3.  Search Screen 

When the 

SEARCH

 symbol (

) is selected the 

Detector Unit enters SEARCH mode.  The SEARCH 
screen allows the Surveyor to locate the pipeline so that 
readings can be taken.  The main components of the 
SEARCH Screen can be seen in more detail in section 
3.5 above.  By studying that section and comparing to 
the example in Fig. 5.4 right, the following can be 
observed:  

Pipeline Location:

 The central circle is indicating that 

the location of the pipeline is behind and to the right of 
the Detector Unit and the Surveyor – the Detector and 
Surveyor always being in the centre of the circle, and 
the pipeline indicated by the straight line crossing the 
circle.  Fig. 5.5 below compares the SEARCH screen to 
the actual positions of the Detector and Pipeline.  As the 
Surveyor rotates right to face the pipeline, the screen will 
show the pipeline move until it is in front of the Surveyor.   

Distance to Pipeline:

 In this example, the distance to the 

overhead position of the pipeline is approximately 3.9ft, as 
shown at the top of the screen.   

Depth of Pipeline: 

The SEARCH screen indicates the 

depth to the centre of the pipeline (

) is 4.3ft.  To change 

this to depth of cover, press the key adjacent to the cover 
symbol (

- bottom LH corner box).  If the pipeline 

diameter has not been entered then this symbol will not be 
shown and only the depth to centre can be displayed.  
Pipeline diameter can be entered from the START-UP 
screen or after a reading has been taken.   

Fig. 5.5 – Position of the Detector 

relative to the pipeline 

Fig. 5.3 – Pipeline Specification 

Confirmation screen 

Fig. 5.4 – Search screen 

Summary of Contents for C-SCAN 2000 Series

Page 1: ...www dynalog co uk SYSTEM MANUAL Dynalog Electronics Limited Bristol England For Model 2010 ...

Page 2: ...a C SCAN 2010 Folders created on root drive DCAPP2010 DCAPP2010 archive DCAPP2010 archive original C SCAN Manual Electronic copy of the manual in Adobe PDF format You must have Adobe Acrobat installed to view the manual C SCAN Updater This program updates the C SCAN firmware in the Detector head unit If you are sent an upgrade file this is the program to use to update your Detector Should you be s...

Page 3: ...r administrative receiver appointed to it or over any part of its undertaking or assets or shall pass a resolution for its winding up otherwise than for the purpose of a bona fide scheme of solvent amalgamation or reconstruction where the resulting entity shall assume all of the liabilities of it or a court of competent jurisdiction shall make an order or shall enter into any voluntary arrangement...

Page 4: ...e of operating C SCAN equipment supplied by Dynalog Electronics Ltd Dynalog reserves the right to make improvements in its products without incurring any obligation to incorporate such improvements into products already sold Specifications instructions and other information contained in this Manual are subject to change without notice Before any setup work or survey work is undertaken these instru...

Page 5: ...ector Unit Display 17 3 5 1 LCD Contrast 18 3 5 2 LCD Backlight 18 3 6 Detector Unit Keypad 18 4 SIGNAL GENERATOR FIELD OPERATIONS 19 4 1 Operating Environments 19 4 2 Survey Information 19 4 3 Connection to Pipeline 19 4 3 1 Location of Injection Point 19 4 3 2 Check Pipeline 19 4 3 3 Signal Interference 20 4 4 Connection Methods 20 4 5 Setting the Signal Current 22 4 6 Pipeline Voltage message 2...

Page 6: ...ecord Sample 34 6 4 5 Subsequent Samples 36 6 4 6 Entering Distance 37 6 4 7 Graphs 38 6 4 8 Low Signal 39 6 4 9 Move Generator 39 6 5 Survey Numbering Memory Storage 39 6 6 Notes on Entering Distances 40 6 7 Chainage 40 6 8 Fault Location 42 6 8 1 Closer Inspection 42 6 8 2 Close Interval Mode 43 7 SURVEY PLANNING AND INTERPRETATION OF RESULTS 47 7 1 Distance Between Survey Points 47 7 2 Attenuat...

Page 7: ...of Return Current 57 8 11 Orientation of Detector to Pipe Axis 58 9 EXAMPLES 59 9 1 Example 1 59 9 2 Example 2 60 10 DEMO MODE 61 11 DCAPP 63 11 1 Additional windows 64 11 1 1 Pipeline layout 64 11 1 2 Table View 64 11 1 3 Pipeline Details 66 11 2 How to download from C SCAN 67 11 3 Saving Printing Exporting 68 11 3 1 Saving 68 11 3 2 Printing 68 11 3 3 Exporting 68 11 4 Advanced Functions 69 11 4...

Page 8: ... 79 16 1 TR Stations The need to disconnect 79 16 2 Generator Connection Problems 79 16 2 1 Connecting to the Pipeline 80 16 2 2 Establishing a good earth 80 16 2 3 Use alternative earth connection 80 16 3 Re call Calibration Settings 81 16 4 Display Messages 82 17 SPECIFICATION 83 18 MAINTENANCE 85 APPENDIX 1 COM PORTS IN WINDOWS 86 APPENDIX 2 LOG SHEET TEMPLATE 86 GLOSSARY 88 Versions used in th...

Page 9: ...several orders of magnitude less than the resistance of the undamaged coating the resultant loss of current even from a single small fault less than 0 1252 in can usually be detected by a significant increase in the apparent rate of current decline over quite a long length of pipeline In practice the existence of one or two small faults on a section of pipeline several hundred feet in length can u...

Page 10: ...ey to provide a permanent record 1 1 Signal Generator The C SCAN Signal Generator is a self contained unit producing a computer controlled AC signal current with a frequency of 937 5 Hz Fig 1 1 Signal Generator The output from the Signal Generator is a sine wave signal at a frequency of 937 5Hz with a nominal maximum voltage of 60V p p 18V RMS The maximum current obtainable is 1 5A 1500mA The RMS ...

Page 11: ...ogether as possible the Detector is positioned in the vertical centreline of the pipeline When the Detector is stationary in this overhead position a sample of 300 readings of the field strength values can be taken over a period of approximately six seconds The computer will then calculate the depth of the pipeline from the base of the Detector to the centre line of the pipeline and the strength o...

Page 12: ...neral use the narrow bandwidth of the filters in the Detector Unit and the collection of 300 signal samples over a period of approximately 6 seconds to eliminate transient interference The instrument can usually be used in the presence of mains AC and is not affected by any residual ripple in operating DC rectified Cathodic Protection systems 2 Unpacking and Activating the C Scan 2010 Survey Syste...

Page 13: ... charge the battery if the charger is left attached The charge can be terminated at any time by removing the charger Pressing the OFF key will prompt you to remove the charger A full charge should last for two to three days of normal survey work depending on level of signal current The battery should not be allowed to discharge completely and if possible the generator should be put on charge at th...

Page 14: ... battery must be charged separately 2 4 Charging the Detector Unit There are two controls for the power supply to the Detector 1 The Main Power isolator switch located in the battery compartment and normally left ON 2 For normal operational use the Detector is switched ON and OFF by pressing the button marked I O on the Detector display panel control keypad The Detector is powered by NiMH Nickel M...

Page 15: ...r will perform some checks and the START UP screen will be displayed The Detector can now be charged Fig 2 3a Time Display screen Fig 2 3b Date Display screen If the display does not activate turn the Main Switch to OFF again ensure the battery caps are fitted properly and wait for 5 seconds then switch it back to ON If the display then activates proceed with charging If the display fails to activ...

Page 16: ...harging cycle may be ended by pressing the key The display will shut off and the unit will enter trickle charge Recovery charging procedure If the NiMH batteries are completely exhausted flat the Detector display will either not activate after the I O button on the display panel is pressed or display a BATTERY LOW warning ensure batteries are installed and main power isolator battery switch is ON ...

Page 17: ...period of time switch the main power isolator to OFF If the unit is to be stored for longer periods of time 3 months or shipped without its shipping crate the batteries must be removed Leaving alkaline batteries in a stored Detector even with the main power isolator Off may result in battery corruption and leakage causing internal damage to the Detector NOTE Survey data storage is NOT affected by ...

Page 18: ...al Generator and Detector Unit looking at the keypad interfaces displays and icons and connections for each part of the C SCAN 2010 system 3 1 Signal Generator Keypad 3 2 Signal Generator Display The Signal Generator has a backlit display providing the surveyor with the current status of the Signal Generator while carrying out a survey The details of the main screen are listed below 1 Battery Capa...

Page 19: ... the use of a laptop or PC The onboard search facility displays 1 Pipeline position 2 GPS coordinates 3 Depth Cover indicator 4 Pipeline diameter 5 Survey and location number 6 Facility for recording pipeline diameter and wall thickness 7 Display of approximate coating conductance in μS m2 8 Display of approximate coating resistance in Ωm2 9 Symbol inclusion for landscape features 10 Graphs includ...

Page 20: ...h as trees walls fences roads rivers pylons etc Symbols are available with the indicator on the left or right side Symbol for GPS 3 5 Detector Unit Display Below is an example of the C SCAN 2010 SEARCH screen showing the component parts of the graphical display during search mode At this initial search stage depth current and distances are approximate Overhead Locator Bars Pipeline Position indica...

Page 21: ... is returned to normal temperatures making it difficult to see the contrast controls on screen In this instance ensure that the Detector is OFF by switching the main power isolator OFF After waiting for a few moments turn the switch ON to activate the Detector the GPS LED will illuminate briefly during start up Wait for a few moments to allow the Detector to complete its checks and then press the ...

Page 22: ...d the Signal Injection Point Selecting a good injection point is a key part of the surveying process When selecting the injection point it should be remembered that in most cases the applied signal will travel in both directions from the Injection Point and that the Detector can operate moving towards the Injection Point Signal Generator as well as away from it Surveying away from the Injection Po...

Page 23: ...e pipeline In this instance the surveyor may experience initial rising current readings due to the anti phase signal on the bonding cable When current readings stop rising the interference has subsided 4 4 Connection Methods Methods of connecting to the pipeline can differ slightly but all require the same basic principle a good low resistance connection to the pipeline and a good low resistance e...

Page 24: ...tifier terminals This completely isolates the pipeline under survey not only from the CP system but also other pipelines that may be protected by the same rectifier from a common buss The Signal Generator Ground connection can now be safely connected to the rectifier s ground bed and the Signal Generator Pipe connection can be attached to the pipeline under survey lead Connecting the Signal Genera...

Page 25: ...ly when Pipe and Earth connections have safely been made should the Signal Generator should be switched ON The Signal Generator will carry out its own internal checks When these checks are completed satisfactorily the Operator can set the signal current The flow diagrams in sections 4 9 and 4 10 below outlines this process The signal current is set using the AUTO MANUAL or RECALL keys AUTO Pressin...

Page 26: ...to check the pipe to soil voltage AC and DC and current AC before proceeding 4 7 Automatic level adjustment To carry out a Current Attenuation Survey it is essential to ensure a constant current signal is applied to the pipeline Once the signal current of the Signal Generator has been set the Automatic Level Adjustment will become active after 1 minute This mode is indicated by the message OUTPUT ...

Page 27: ...should be zero for good connection 3 Signal Generator to earth connection dependent on earthing system used see section 4 4 If the user is unable to apply any current at all i e no output from the Signal Generator or the message Output disconnected high resistance displayed it can often be caused by a high value for item 3 above but this must not be assumed and all components of the circuit need t...

Page 28: ...TE Battery When STORING for Long periods On Off MANUAL HOLD AUTO AUTO Operation C SCAN GENERATOR CHECKING OK V3 33 AUTO for 600mA or for MANUAL Hold AUTO for 1000mA AUTO 937 5Hz TARGET 600mA 100 16 40 AUTO 937 5Hz 150mA 600mA Checking 100 08 40 AUTO 937 5Hz 408mA 600mA 99 0 06 12 o27 OUTPUT LOCKED SET to 600mA 15w 10 7v 10Ω 1 Minute 99 7 06 49 i25 GENERATOR OUTPUT SET to 600mA 16w 10 7v 10Ω S Reca...

Page 29: ...ANUAL 937 5Hz 408mA 750mA HOLD AUTO to enter MANUAL set Continue as AUTO Operation MANUAL use Keys to change Set to 601mA AUTO to SET Press and release increases current by 1mA S Recall MANUAL use Keys to change Set to 610mA AUTO to SET Press and HOLD increases current by 10mA steps S Recall symbol shows increment by 10 Continue to HOLD increases current by 50mA steps after next 50mA boundary S Re...

Page 30: ...en will automatically turn on the GPS to ensure that GPS data is recorded during surveying Pressing the GPS ON OFF key will manually activate the GPS system and after a few seconds the screen will change to GPS ON to indicate that GPS is now searching 5 2 Pipeline Specification Screen In order for C SCAN to calculate the conductance resistance and depth of cover the pipeline diameter needs to be e...

Page 31: ...pipeline so that readings can be taken The main components of the SEARCH Screen can be seen in more detail in section 3 5 above By studying that section and comparing to the example in Fig 5 4 right the following can be observed Pipeline Location The central circle is indicating that the location of the pipeline is behind and to the right of the Detector Unit and the Surveyor the Detector and Surv...

Page 32: ... the symbol GPS The GPS status indication will show either ACQUIRING GPS data is blank waiting for signal from satellites BAD no satellites in view GOOD satellites in view and acquired GPX external GPS being used ANT FAIL GPS antenna failure NOTE More information about the GPS system can be found in section 12 below 5 4 Menu Screen Menu Pressing the MENU button from the START UP screen accesses th...

Page 33: ...ing out a survey are described in section 6 DETECTOR UNIT Field Operations Option Description Section Prog Upgrade the Firmware inside the C SCAN 14 Demo Turn On Off Demo mode 10 Exit screen GPS Setup Re configure GPS system Turn on External GPS capability Update Location 12 Date Change the date stored in C SCAN 2 4 Time Change the time stored in C SCAN 2 4 Calib Recall the factory calibration det...

Page 34: ...pipeline in both current attenuation and depth profiles Any areas which produce high attenuation values can be analysed and repaired where necessary Attenuation values are discussed in section 7 2 Periodic Survey Subsequent Surveys For subsequent surveys readings can be taken at much larger intervals as C SCAN s ability to produce absolute results means that these readings can be directly compared...

Page 35: ...se Report Once downloaded the data can be analysed using DCAPP and either printer or exported for use in other programs or documents reports 11 4 3 Clear C SCAN Once the data has been successfully downloaded the detector memory can be cleared before the next survey 11 5 6 3 Survey Planning No two pipelines will produce identical survey results because of variations in size coating age soil conditi...

Page 36: ...e changes direction with a relatively small radius bend It is suggested that in these areas the survey points should be relatively close together 6 3 4 Reference Readings It may be desirable to compare absolute readings from one survey to the next a reference reading If reference readings are considered necessary then these should be taken at locations which must be identifiable and permanent so t...

Page 37: ...ion keys are displayed the CALCULATION and CLOSE keys CALCULATION The CALCULATION key takes a large sample of readings and converts these readings into accurate data During this sampling it is important that the Detector is held stationary and perpendicular to the pipeline Any movement will upset the readings resulting in data errors CLOSE CLOSE The CLOSE key is for CLOSE INTERVAL CURRENT SURVEY m...

Page 38: ...lowing PIPELINE SPECIFICATION If the diameter and wall thickness of the pipeline were not set before the survey was started then this pipe symbol will flash and the Surveyor is given a second opportunity to enter the data If the details were previously entered then no symbol will appear as in this example VISIBLE FEATURE This enables a graphic icon representing a landscape feature to be noted and ...

Page 39: ...ey points depending on the coating area being surveyed Attention to specific sections of pipeline Road or river crossings or areas of high consequence such as built up areas may warrant closer inspection Access to the pipeline Survey points will often be dictated by the topography of the area and will vary if the ideal position is in the middle of a river or road etc Quality of coating The further...

Page 40: ...ed when a section of pipeline is being halved to isolate any anomalies Fig 6 9 Enter Distance screen Until a distance has been entered into the Detector the STORE button will not be visible Once a distance is entered or the GPS distance selected the store button appears and the data can be stored As the distance is entered it will appear at the bottom of the screen in this example the distance fro...

Page 41: ... contact with the ground per metre of pipeline the pipeline diameter For a pipeline of a given diameter the attenuation value is an absolute indicator of dielectric performance of the coating the lower the figure the better If comparing two pipelines of different diameters but with identical coating dielectric performance the attenuation values will be proportional to the diameter For more informa...

Page 42: ...e When moving the Signal Generator two important points should be remembered 1 Ensure there is some overlap with the previous survey so that no gaps appear in the data Remember that the first 30 50ft from the injection point cannot be surveyed 2 When the Generator is moved or the output current changed a new survey must be started 6 5 Survey Numbering Memory Storage The first survey stored into an...

Page 43: ... that would be calculated by GPS versus the actual pipeline distance The increase in error can be seen with the increase in angle as demonstrated below Bend angle Pipeline Distance Direct distance error 0 328 328 0 10 328 328 0 20 328 322 1 30 331 318 3 40 335 308 7 50 338 299 11 60 341 285 16 70 344 269 21 80 348 253 27 90 351 233 33 6 7 Chainage Chainage is the term given to incremental distance...

Page 44: ...s a distance marker of 3 678ft and the last point is at CP marker 11 which has a distance marker of 4 578ft The two intermediate points are 300ft apart Point CP number Line distance distance chainage 00 10 3678 3678 01 300 3978 02 300 4278 03 11 4578 4578 Point 00 is entered as a chainage start point with a value of 3678ft Points 01 and 02 are entered as distance from previous point as 300ft Point...

Page 45: ...peline we know that the anomaly must lie between points 02 and 04 Fig 6 15 Halving Technique This technique of halving can be repeated again and again until the section with the anomaly is identified or it is shown that a length of the pipeline has generally poor coating However it must be remembered that when a survey point is taken closer to the Generator than the previous point a change of surv...

Page 46: ...the points will increment in order If you switch to Chainage mode Fig 6 17 then the using the and arrows will increment in distance order So in the example above we can switch to chainage mode and scroll through the points and see the attenuation between 02 and 04 is 19 25 mB m 6 8 2 Close Interval Mode Once a Closer Inspection has been carried out on a section of pipeline with higher than average...

Page 47: ... different interval Fig 6 19 Spacing Selection Once a selection has been made the Close Interval survey can begin and the CLOSE INTERVAL screen is shown Fig 6 20 The CLOSE INTERVAL screen contains many of the elements of the SEARCH screen that are already familiar As with the SEARCH screen the Pipeline Position Indicator is shown as a circle and line but this time it is located in the top right of...

Page 48: ...is is shown on the following screen after several readings have been taken Fig 6 21 Close Interval Profile The UP and DOWN keys allow you to zoom in on the graph Press to ignore the sample and retake the reading or press to accept the reading After several readings the current profile shown by the graph identifies where the current on the pipeline starts to drop before levelling out again This dro...

Page 49: ...line such as a cross bond etc This type of profile can also be produced by foreign contact with the pipeline taps branches or T s etc as discussed in section 8 It is often quite normal to see a small rise in current at the base of the slope See section 8 10 It is possible to have several drops in current with the current levelling out in between signifying several isolated faults within one area T...

Page 50: ...ult may raise the attenuation levels by a noticeable amount when readings are taken at the baseline 300ft intervals this same fault may not raise attenuation levels enough to be noticed when readings are taken at greater intervals e g 3000ft So the distance between survey points may need to be adjusted depending on the level of detail that is required 7 2 Attenuation Values Attenuation figures mea...

Page 51: ...ed in surveys has been defined by NACE in TM0102 2002 page 6 and is defined for pipeline coatings of various qualities as follows Less than 100 μS m2 Excellent coating 100uS to 500 μS m2 Good to fair coating 500uS to 2000 μS m2 Fair to bad coating Above 2000 μS m2 Bad to no coating The unit μS m2 is one millionth micro of a Siemen per square metre It should be noted that the NACE values are calcul...

Page 52: ...y either conductance or resistance NOTE It is advisable to use conductance rather than resistance when displaying the data graphically This is because any section of excellent coating will have a very high resistance meaning areas of poor coating will have a low resistance and these data points will be very close to the horizontal axis which will be difficult to read As conductance is the reciproc...

Page 53: ...f the signal goes in one direction and half in the other as is normally the case If a survey starts at an insulating joint flange then the current is doubled as all the signal heads in the same direction See section 8 6 for more information Range Vs Attenuation 1 10 100 1000 10000 100000 1000000 0 1 2 3 4 5 Attenuation mB m Distance ft 1000mA 600mA 150mA Fig 7 3 Range v Attenuation 7 5 Fault Size ...

Page 54: ...o locate specific faults the suspect section should be narrowed down to 50 150ft This will either be done by using the halving technique or by taking attenuation readings at closer intervals in areas commonly associated with faults see 6 3 3 The Operator should then take readings of current only at intervals of 10 15ft over the suspect section using the Close Interval Mode described in section 6 8...

Page 55: ...tant damage e Repeat a periodically say every 1 2 years if possible taking readings at exactly the same places each time to facilitate comparisons and the identification of rates of pipeline deterioration f Correlate data on local mB m losses or percentage current loss with actual fault sizes for different coatings sizes of pipe and soil conditions and correlate CP current drain with local attenua...

Page 56: ...t dry summer will affect the results but experience to date suggests that changes in attenuation arising from this cause are unlikely to exceed 5 This variation can be allowed for and is unlikely to affect the validity of the results For regular check surveys it is suggested that any given pipeline is always surveyed at the same time of year to minimise possible interpretation errors from this sou...

Page 57: ...nt used in standard cathodic protection systems provided it is within certain limits see 4 6 on page 23 The C SCAN signal will be significantly distorted if a Pearson type survey is carried out on any section of the same pipeline at the same time as a C SCAN survey Some forms of military signals using powerful transmitters which are located near to a pipeline can result in the pipeline acting as a...

Page 58: ...onsiderable difference in signal strength 8 6 Insulating Joints Flanges Where pipelines enter hazardous areas or at the interface between a section protected by sacrificial anodes and a section protected by an applied CP potential e g at the shore line it is sometimes the practice to insert an insulating joint flange which electrically isolates one section of pipeline from the other If the C SCAN ...

Page 59: ... surveyed as if the joint were not there Use the IJ as the injection point This has the additional benefit that the entire signal will be sent in one direction along the pipeline Use the IJ to separate between the injection and earth points there s no need for a separate earth connection In this instance two separate surveys can be carried out One in either direction Use the Earth Spikes for the g...

Page 60: ... pipelines are sleeved under a roadway the pipeline is encased in a section of metal pipe of larger diameter which provides protection from mechanical damage However it is still possible to detect wrap faults on the enclosed pipeline provided that a There is no electrical connection between the pipe and the sleeve b The sleeve itself has some form of coating inside and out c The annular space betw...

Page 61: ...Although the main source of potential operator error is eliminated there is still the necessity to ensure that the axis of the Detector antenna is perpendicular to the pipeline in the vertical plane This is not a problem in normal conditions where the pipeline is effectively horizontal and the instrument vertical But where a pipeline has been installed on a steep slope and is parallel to the groun...

Page 62: ... 6 survey points taken over 3 776ft These two anomaly areas were identified by the high attenuations seen between survey points 1 2 and 4 5 A C SCAN Close Interval survey was then carried out from just before survey point 1 The resulting current only survey identified the defect located in mid point of the steep drop in current Images taken from DCAPP ...

Page 63: ...a high attenuation between survey points 2 3 As in Example 1 a subsequent Close Interval survey was carried out The results of this showed defects at 30ft intervals This spacing lined up with the joint wrappings The pipeline was excavated at these points and the defective joints re wrapped NOTE CIPS survey did not find these defects due to masking effects of the CP Images from DCAPP and printed to...

Page 64: ...the process of locating the pipeline and will continue to repeat the search until the Calculation button is selected To ensure that no actual surveys are affected the demo function is cancelled if the Detector is put into standby or powered off at the battery switch Although it must be remembered that all data saved whilst in demo mode will be saved to the Detector s memory so to replicate faithfu...

Page 65: ...N29 534 012W02 850 0 0 0 0 0 00 08 21 44 5 25 44N29 485 012W03 050 918 6 918 6 9 20 09 13 64 5 81 44N29 467 012W03 150 446 2 1364 8 2 89 10 10 44 5 15 44N29 440 012W03 300 672 6 2037 4 1 13 11 9 97 6 43 44N29 430 012W03 384 367 5 2404 9 0 36 12 5 79 5 61 44N29 424 012W03 539 672 6 3077 4 2 30 Survey 3 S 02 Data Point Current Depth Latitude Longitude Distance Chainage Attenuation 13 30 00 2 99 44N2...

Page 66: ...onductance µS Ability to disable points Ability to re sequence data points by GPS data Ability to interpolate GPS data Ability to split and reverse survey data Ability to filter data Auto Analyse function Printing and display of visual feature symbol Easy addition of comments for each point Pan and Zoom of all graphs Ability to re format existing DCAPP files to new format To install DCAPP GE inser...

Page 67: ...ick on individual survey points and the data for that point will be displayed in the Point data window on the START UP screen Similarly when a survey point is selected you can add information about it in the Comments window The active point is highlighted in red Fig 11 3 Pipeline layout 11 1 2 Table View The TABLE VIEW shows the tabular data for a particular survey If you wish to ignore a particul...

Page 68: ...filtered at a predetermined interval e g 25m Adjust the slide to increase or decrease the filter distance This can be useful if data points were taken at narrow intervals for depth of cover surveys but such close intervals are not good for attenuation surveys By filtering the data at greater intervals means the data from a single survey can be analysed for both depth of cover and attenuation Use I...

Page 69: ...n reverse form and will assume that the Start Point is always correct which may not be the case Selecting Remove From Start will analyse any negative attenuations at the start of a survey after the initial calculations have been completed 11 1 3 Pipeline Details The PIPELINE DETAILS form allows the user to enter useful information about the pipeline and the survey conditions This can be used as a ...

Page 70: ...hree options shown below Select the option C SCAN 2010 and the data will start to transmit During transmission the data will briefly appear in the download data window shown below Once completed this window will automatically close and the DCAPP start up screen will be shown this time containing the downloaded survey data When data is downloaded from DCAPP a backup of the data is automatically sav...

Page 71: ... data set containing all the surveys downloaded not just the survey being viewed 11 3 2 Printing To Print the data in DCAPP simply click on the PRINT icon this brings up the Print window with the following options Print Data This will print the TABLE VIEW of the data only Print Graphs This will print the Graphs of the data only Print Data and Graphs Prints both Table View and Graphs The printed da...

Page 72: ...ig 11 10 Tools menu When you select the MAP function from the Start up screen toolbar DCAPP will display the current survey data on any installed mapping software that uses KML files such as Google Earth The mapping software must be installed and KML file extensions must be associated with it The survey must also contain GPS data If you wish to include other surveys that have been previously downl...

Page 73: ...y to take its distances based on the GPS separation rather than manually entered distances Interpolate Extrapolate GPS GPS points can be added where no data exists Generate Missing GPS only If a gap in the GPS data exists GPS was off view of satellites obstructed then DCAPP can interpolate the data and add missing GPS points Re Generate GPS from Suppressed Points ONLY GPS data will be re calculate...

Page 74: ...p screen select a single point with left mouse button then right click the point to open up the following options Suppress Point Suppresses a survey point the same way as with Table view Correct GPS at Point Erroneous GPS data can be corrected Survey Change Split Survey This splits a single survey into two separate surveys such as when a surveyor accidentally surveys across a generator injection p...

Page 75: ...hat are acquired the more accurate the displayed position will be The SEARCH screen will display the co ordinates of the last good signal so if signal is lost for any reason the position displayed could be incorrect To confirm if the co ordinates displayed are current simply press the GPS SAT key which will display the status of the GPS signal and the number of satellites acquired Fig 12 1 Latitud...

Page 76: ...that enables the GPS unit to remain on whilst all other devices are switched off To enter this mode press the ON Off key with GPS still on A message will be shown enabling the unit to be switched to Power Save mode with the GPS left running in the background This occurs only if the GPS is on prior to switching off the Detector A 30 second countdown will be shown during which the display will be ac...

Page 77: ... UPDATE LOC function This information can be confirmed via the INFO screen accessed from the MENU button 13 BATTERY INFORMATION 13 1 Battery Life The power consumption of the C SCAN 2010 varies depending on use This can be split into a number of categories as shown below along with the associated power consumption Switching the main isolator switch to OFF will disconnect the batteries It is recomm...

Page 78: ...Leaders in Pipeline Survey Systems C C C S S SC C CA A AN N N 2 2 20 0 01 1 10 0 0 SYSTEM MANUAL Version 6 03i 75 poor quality batteries especially re chargeable types will not deliver the same power ...

Page 79: ...y mode even if GPS is running Leaving the Detector in Search mode or any Menu screen will prevent the auto shutdown The antennae status is shown on the START UP screen for reference Antennae OFF Antennae ON 14 UPGRADING Dynalog s Upgrader software can be used to update the firmware within the Detector or confirm if the latest version is being used To begin install the Upgrader program from the App...

Page 80: ...urveys saved to the Detector s internal memory Always download any data before upgrading 15 DIAGNOSTICS If it is suspected that there is a fault with the Detector the Diagnostics program can be used to interrogate and confirm the correct functioning of the various sub systems within the Detector If an error is found a report is produced which can be sent to Dynalog for assessment and further advic...

Page 81: ...as shown opposite Fig 15 4 Failures identified If any failures are detected a diagnostics report is produced along with the option to send the report to Dynalog for further analysis To do this click YES Fig 15 5 Diagnostics report A print screen will appear to allow you to print the test report Alternatively you can locate the test report on you computer and email this to Dynalog tech dynalog co u...

Page 82: ...s happens you have several choices i Survey up to the TR station then move the generator to the other side of the TR station and connect to another CP test post and survey back to the TR station in the other direction as shown below In this instance it will not be possible to overlap surveys as the entire signal will leave the pipeline at the TR station ii Turn off the TR station but do not discon...

Page 83: ...moved from side to side both during and after installation so that ground contact is maintained along the length of the spike If the ground is dry remove the Earth Spikes and fill the holes with water before replacing them Ensure ground contact along the length of the spike Brush away an area of topsoil and lay the Earth Spikes horizontally before replacing the topsoil As above but with soil wette...

Page 84: ...tails will be automatically restored from fixed memory If an upgrade to the Detector has been completed then similarly the calibration details are checked and restored automatically Manual checking can be done by the user at any time by the following procedure 1 Press MENU 2 Press SETUP 3 Press CALIB 4 Press FACTOR Once the calibration data has been recalled the Detector will return to the CALIB s...

Page 85: ...sult computer users manual Ensure separator is either full stop or comma Contact Dynalog for recovery assistance Cause Batteries low or depleted Antenna not responding antenna fail message will also show GPS does not have clear view of sky Low batteries GPS antenna damaged not responding GPS system down Detector memory is full Calibration information has been damaged or manually changed incorrectl...

Page 86: ...eet 5 0 to 9 metres 30 feet Features Internal Trimble 12 channel GPS system Accuracy 2m 6 5 ft 500 point survey memory with over 100 separate surveys stored Rechargeable batteries NiMH with 3 hour fast charger charger input 100 240vAC 50 60Hz Survey time on full charge 13 hours continuous 4 5 days Operating temperature range 20 to 40o C 4 to 104o F Note battery capacity reduces at low temperatures...

Page 87: ...ut 1500mA 1 5A RMS AC coupled at 937 5Hz Survey time on internal batteries on external power 8 hrs at 600mA Indefinite depending on capacity of power source Operating temperature range 20 to 40o C 4 to 104o F NOTE battery capacity reduces at low temperatures Connectors 2 x shrouded 4mm output sockets 1 x multi pole charger and external power socket 1 x USB Interface socket General Membrane key pad...

Page 88: ...ate damage within the system that cannot be seen Periodically check the fittings and bolts to ensure they have not worked loose which could lead to water ingress Signal Generator Battery Replacement As every battery has a life expectancy it is likely that at some point the Signal Generator battery will require replacement Although Dynalog would recommend returning the Signal Generator for battery ...

Page 89: ...n addition to COM1 will be shown and this can be selected in any of the required programs DCAPP Upgrader Diagnostics etc If as well as C SCAN several devices are connected to a computer then a list of active COM ports will be available and it can be difficult to know which to select While in some instances it may be appropriate to try each one in turn information about each peripheral can be obtai...

Page 90: ...Leaders in Pipeline Survey Systems C C C S S SC C CA A AN N N 2 2 20 0 01 1 10 0 0 SYSTEM MANUAL Version 6 03i 87 ...

Page 91: ... Firmware Core programme running inside the Detector Ground Lead Used to connect the Signal Generator to the Earth Spikes GPS Distance The distance between two points in straight line This can differ to the actual distance when measuring the route of the pipeline Halving The technique used to take readings half way between the previous two readings thus isolating each half of the section to aid in...

Reviews: