Leaders in Pipelin
e Survey Systems
C
C
C
-
-
-
S
S
S
C
C
C
A
A
A
N
N
N
2
2
2
0
0
0
1
1
1
0
0
0
SYSTEM MANUAL Version 6.03i
71
11.4.3. Auto Analyse
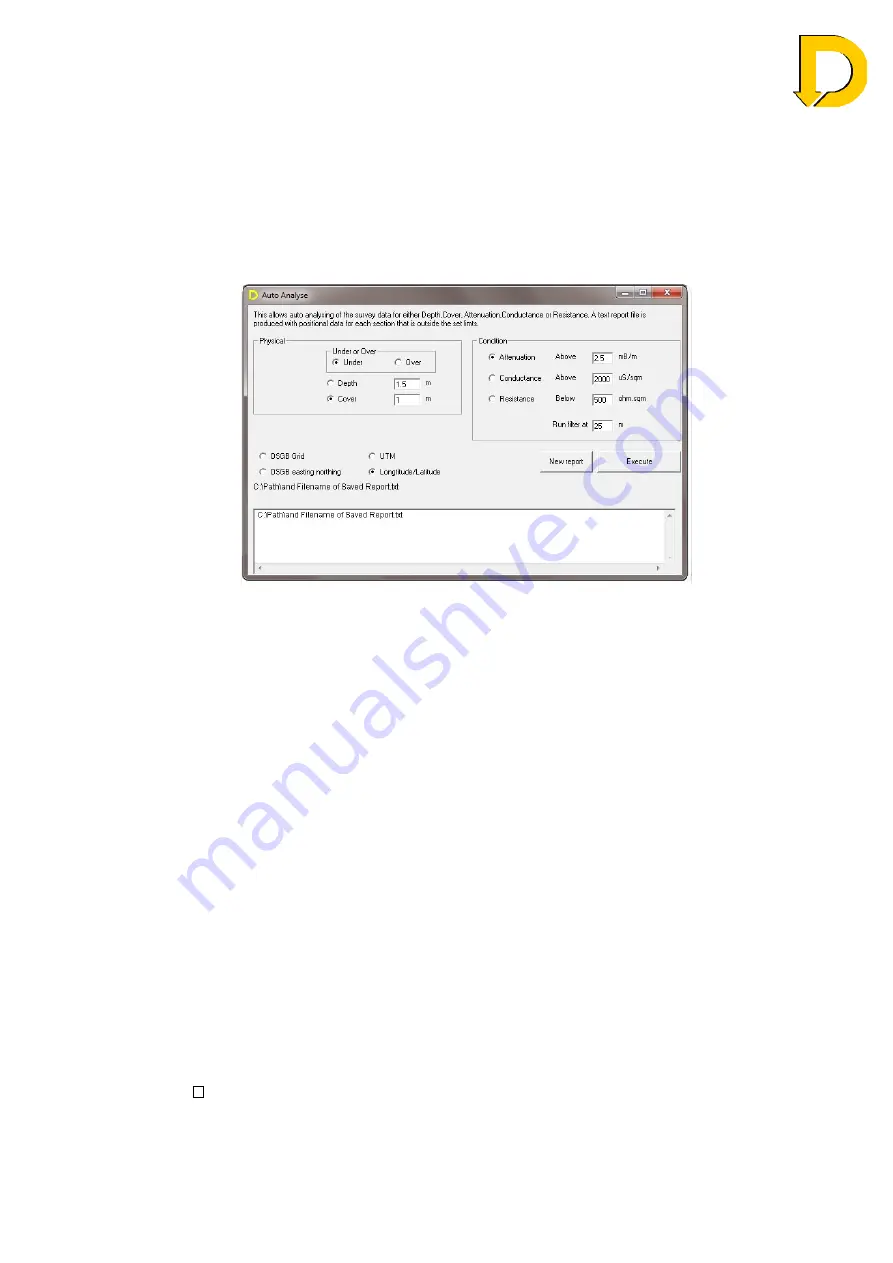
The AUTO ANALYSE function in DCAPP can be used to produce a text report based on
any
Physical
and
Conditional
results of a survey which fall outside of any set limits. For
example, you can use the Auto Analyse function to process the data and indicate which
survey points are under or over a certain depth of cover, quickly highlighting areas of the
pipeline that are too close to the surface. When you have defined the
Physical
and
Conditional
limits click
EXECUTE
to produce the report, which will be displayed in the
window and automatically saved to the same destination as the original survey. The path
and filename of the report is displayed on the AUTO ANALYSE screen.
Fig 11.13 – Auto analyse screen
11.4.4. Data Manipulation
When viewing a graph in the Start-up screen, select a single point with left mouse button
then right-click the point to open up the following options:
Suppress Point
Suppresses a survey point the same way as with Table
view
Correct GPS at Point
Erroneous GPS data can be corrected
Survey Change:
- Split Survey
This splits a single survey into two separate surveys, such
as when a surveyor accidentally surveys across a
generator injection point. Splitting a survey will keep the
original survey and add the two split surveys to the end of
the data set as new surveys
- Reverse Whole
Survey
If a survey is taken in the wrong direction, i.e. towards a
Signal Generator injection point, then the whole survey
can be reversed
Copy to Clipboard
Each graph can be copied to the clipboard for pasting into
other programs
11.4.5. Show Close Interval Plots
In normal circumstances the Attenuation and GPS plots in DCAPP are disabled when
viewing
Close Interval
surveys, as they can be misleading. Attenuation and GPS readings
taken at close intervals can display erroneous data, but if you wish to view this data then
select:
Show plots in Close Interval


