72
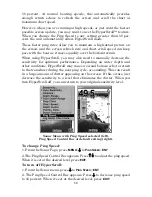
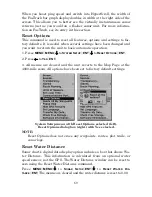
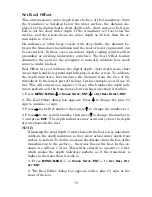
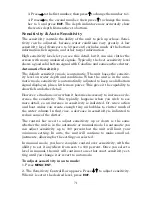
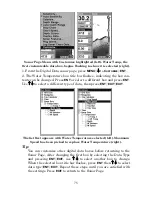
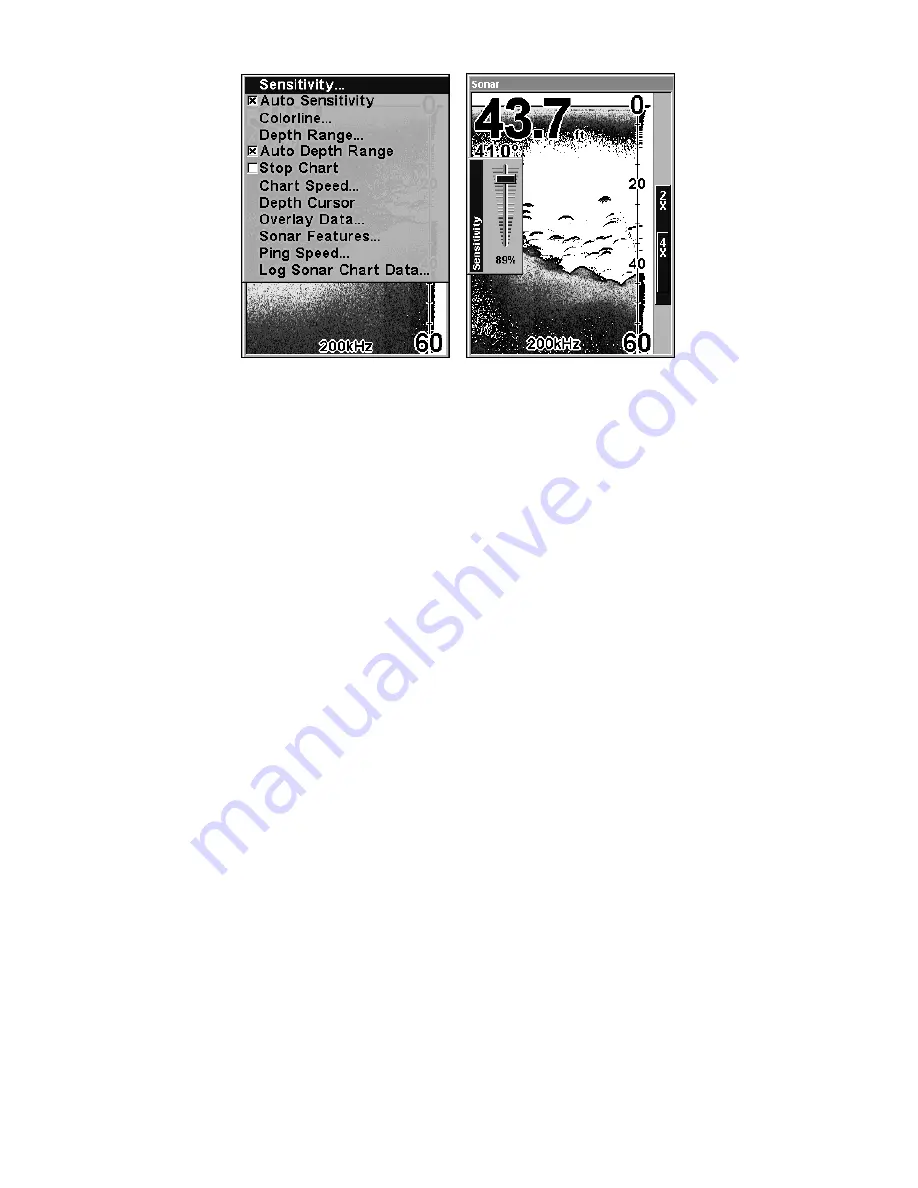
Sonar Menu with Sensitivity selected (left).
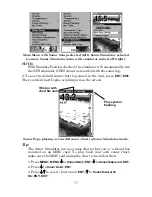
The Sensitivity Control Bar (right).
To adjust sensitivity in manual mode:
1. From the Sonar Page, press
MENU
|
↓
to
A
UTO
S
ENSITIVITY
|
ENT
.
2. Press
↑
to
S
ENSITIVITY
|
ENT
and the Sensitivity Control Bar appears.
Press
↓
↑
to pick a different sensitivity setting. When it is set at the
desired level, press
EXIT
.
NOTE:
To return to the original factory setting for Auto Sensitivity, see the
entry in this section on Reset Options. If sensitivity is in manual
mode, the Reset Options command will switch it back to Auto.
Tip:
For quicker sensitivity adjustments, try leaving the Sensitivity
Control Bar on the screen as the chart scrolls. You can see the
changes on the screen as you press the up or down arrows. This is
handy when there's a lot of clutter in the water and you are
matching the sensitivity to rapidly changing water conditions.
Sonar Chart Mode
The default color scheme for the sonar chart is white background, but
there are other variations. You can select the chart to be displayed in
Grayscale, Reverse Grayscale, Blue Background, Nightview, IceView,
or Bottom Color Tracking.
To change the chart mode color scheme:
1. From the Sonar Page, press
MENU
|
↓
to
S
ONAR
F
EATURES
|
ENT
.
2. Press
↓
to
S
ONAR
C
HART
M
ODE
|
ENT
.
3. Press
↓
↑
to
Mode Name
|
ENT
.
4. Press
EXIT
|
EXIT
to return to the Sonar Page.
Summary of Contents for IntelliMap 502C iGPS
Page 92: ...84 Notes ...
Page 188: ...180 Notes ...
Page 189: ...181 Notes ...
Page 190: ...182 Notes ...


