68
Phone:(910) 392
‐
2490
Fax: (910) 392
‐
2123
416 Landmark Drive
Wilmington, NC 28412
www.easterninstruments.com
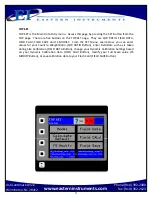
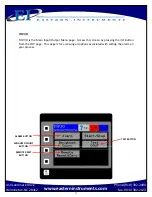
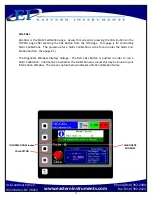
TOP.RUN
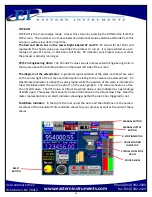
TOP.RUN is the main display mode. Access this screen by pressing the RUN Bu on from the
TOP screen. The customer can choose between Automa c Mode and Manual Mode from this
screen as well as view data in real me.
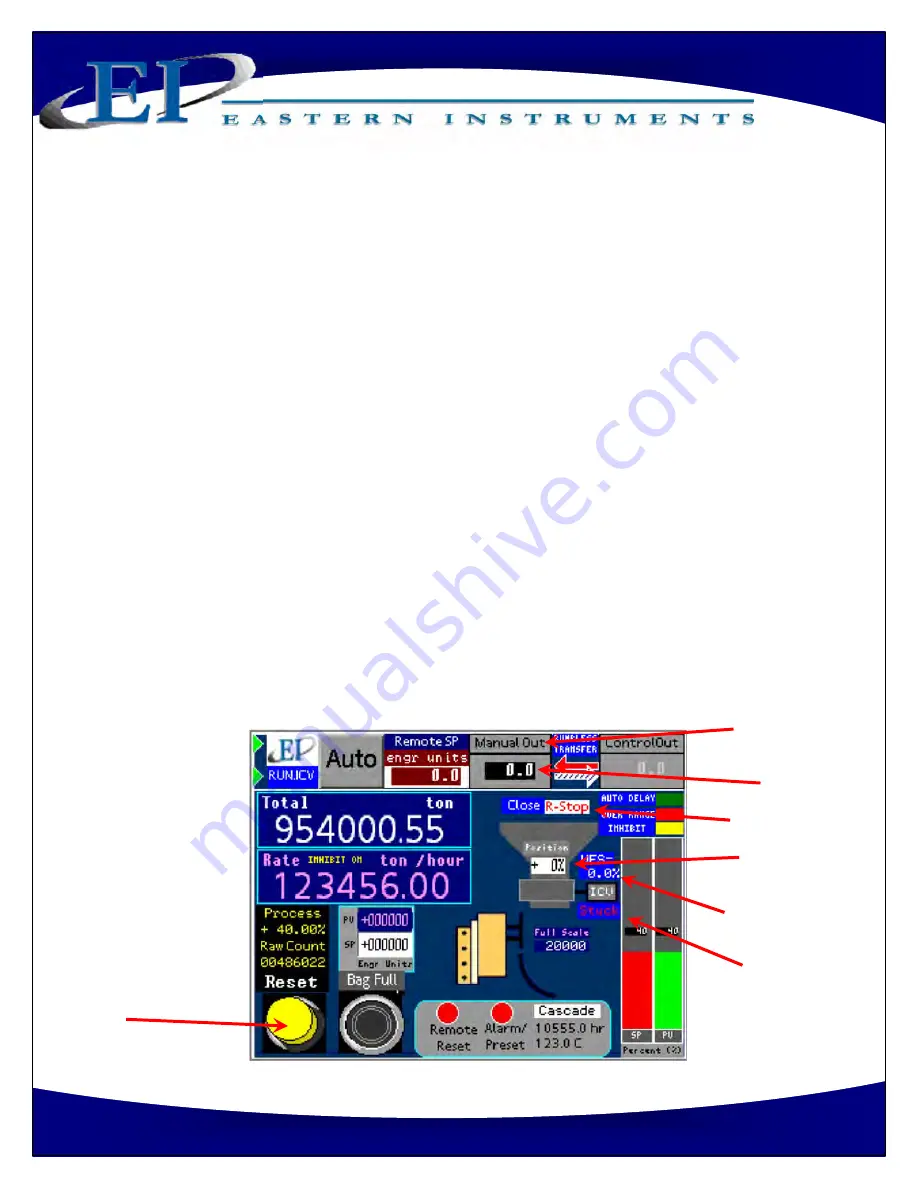
The Red and Green Bar on the Lower Right labeled SP and PV
: SP stands for Set Point and
represents the chosen value you would like the process to run at. It is represented as a per
‐
centage of your EFS value, or Electronic Full Scale. PV indicates your Process Value, or what
the process is actually running at.
PV/SP in Engineering Units:
The SP and PV values are also represented in Engineering Units in
the square above the Run/Stop bu on on the lower le side of the screen.
The diagram of the valve/meter:
A graphical representa on of the valve and meter are seen
on the center right of the screen and informa on rela ng to the valve can be viewed here. An
Open/Closed indicator is above the valve graphic while the posi on of the valve is indicated in
the white block under the word “posi on” on the valve graphic. The value is shown as a frac
‐
on of 100% open. The VFS Value, or Virtual Flow Stop Value is also indicated as a percentage
of 100% open. Please see the manual for more informa on on the Virtual Flow Stop. Near the
meter representa on is an alarm indicator showing whether the alarm has triggered or not.
Total/Rate Indicator:
In the top le corner under the Auto and Man Bu ons are the numeri
‐
cal values of the calculated Total and Rate values for your process as well as the units of these
values.
RESET
BUTTON
MANUAL BUTTON
MANUAL OUTPUT
BUTTON
R
‐
STOP INDICATOR
VALVE POSITION
INDICATOR
VIRTUAL FLOW STOP
VALUE
STUCK ALARM


