Introduction
Eaton ePDU G3 Troubleshooting Guide P-164000278—Rev 1
www.eaton.com/ePDU
5
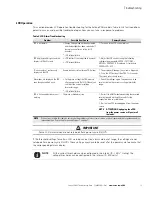
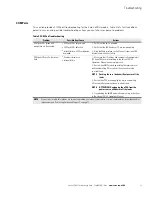
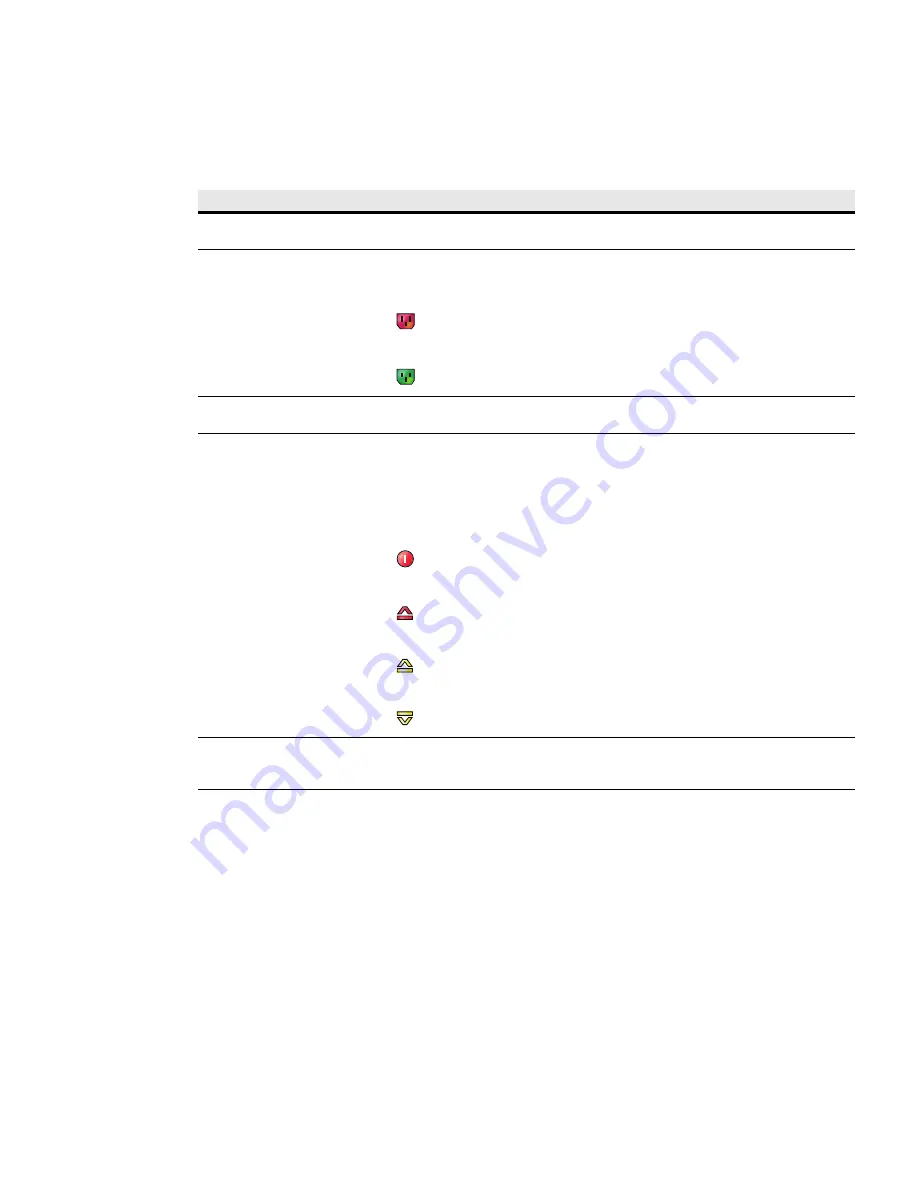
Table 3 provides descriptions of the Web interface components that help you troubleshoot alarms.
Table 3. Web Page Notifications Areas
Area
Description
1 - Application Header Bar
The header bar identifies which Eaton Eaton ePDU Web application is within the host window
(Managed [MA], Metered Input [MI], Metered Outlet [MO], In-Line Metered [IL], or Switched [SW]).
2 - Outlet Icons
Roll over any outlet icon to see the type of outlet and whether there is an alarm. (A gray outlet
status indicates that the outlet management feature could be damaged.)
Outlet is Off
Outlet is on
3 - Active Alarms Page Link (when
active)
The words “Active Alarms” in the alarm notification sentence link to the Active Alarms page.
4- Current Alarms (when active)
A message notifies you that there are active alarms, such as:
“Warning, some alarms fired, please refer to the Active Alarms | Last Refresh:
dd/mm/yyyy -
hh:hh:ss”
An alarm indicator also appears as a notification in the refresh bar at the bottom of the window.
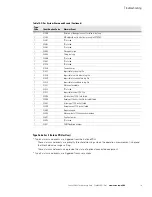
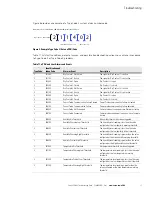
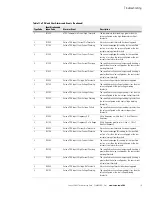
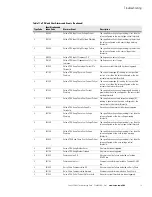
The alarm symbols that can display are:
Active Alarms Present
High Critical Threshold Alarm
High Warning Threshold Alarm
Low Warning Threshold Alarm
5- Active Alarms Menu Selection
This indicator alerts you to the presence of currently active system alarms. It is in the menu
hierarchy. When alarms are active, the text for Active Alarms is red. Selecting Active Alarms opens
the Active Alarms page and displays the current active alarms.
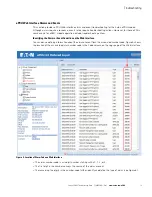
Checking for E-mail Notifications with History Reports
Use the Web interface to set e-mail notifications (E-mail Notification page) and trap receivers (Trap Notification
page). E-mail notifications include comprehensive or filtered event history reports attached to daily e-mail
messages. The detailed data logs you receive can be useful for historical statistical analysis and diagnostics.


