DIGITAL ECU TUNER 3 – User Manual
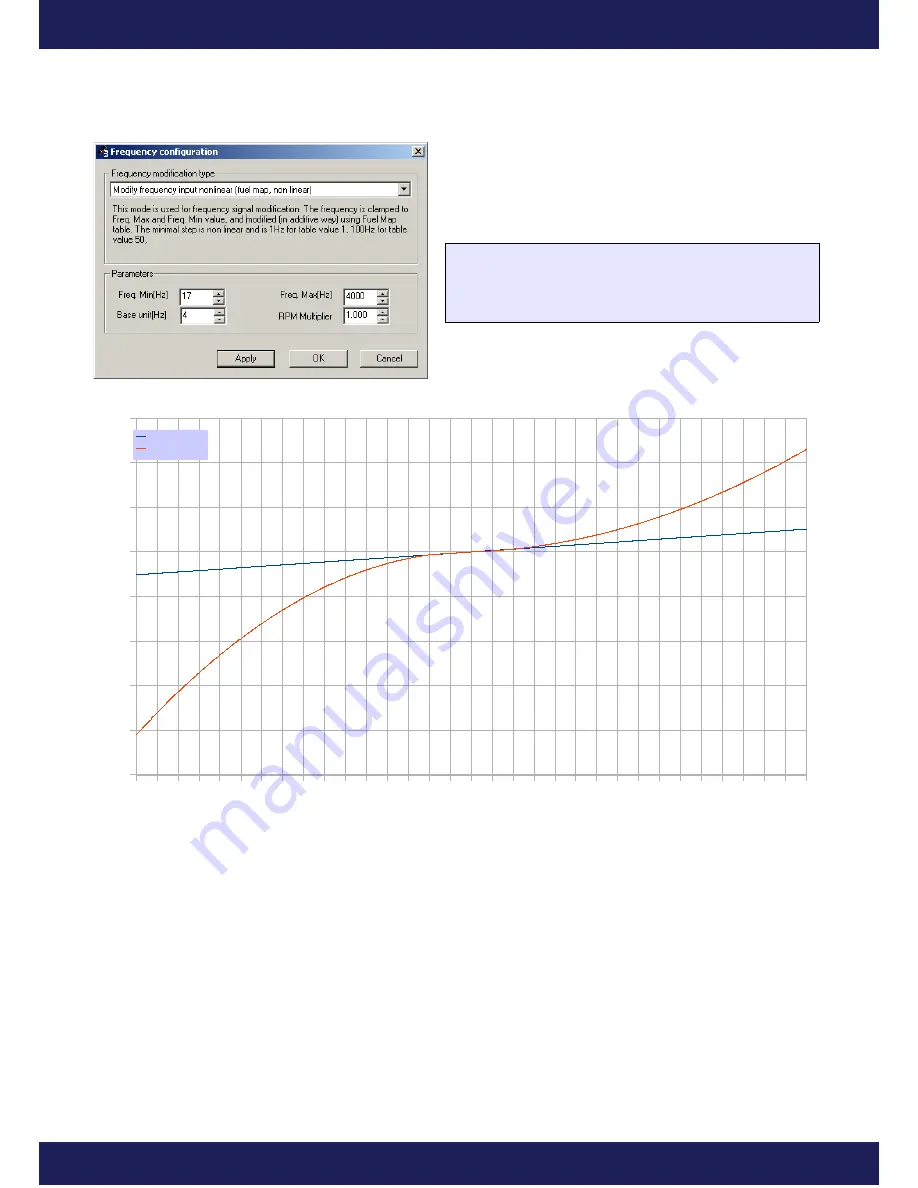
In the
nonlinear
mode, table values are rising in the
exponential way. There is a comparison of the frequency
change value for the linear and nonlinear mode on the chart
below:
FreqOut
= F(MapValue)
If (
FreqOut
< FreqMin)
FreqOut
= FreqMin
If (
FreqOut
> FreqMax)
FreqOut
= FreqMax
It is possible to preview the nonlinear values on the map. To do this, click the right mouse button on the map area
and choose Display As/ Frequency on the context menu.
Page 33
www.ecumaster.com
-128
-120
-112
-104
-96
-88
-80
-72
-64
-56
-48
-40
-32
-24
-16
-8
0
8
16
24
32
40
48
56
64
72
80
88
96
104
112
120
128
-2500
-2000
-1500
-1000
-500
0
500
1000
1500
Linear mode
Nonlinear mode


