You can select which sensor’s values you want to view
by clicking the corresponding
crosshair button
(4)
in
the sidebar. The display of alerts that were recorded by
the respective sensor can be toggled via the
bell
buttons
(5)
. If this feature is active, all dates on which
alerts were triggered are highlighted by a
yellow border
(6)
. The time frame can be selected at the lower end of
the
side bar
(8)
. You can display a week or an entire
year and navigate the history via the two arrows.
5.2.2 Customizing the Layout
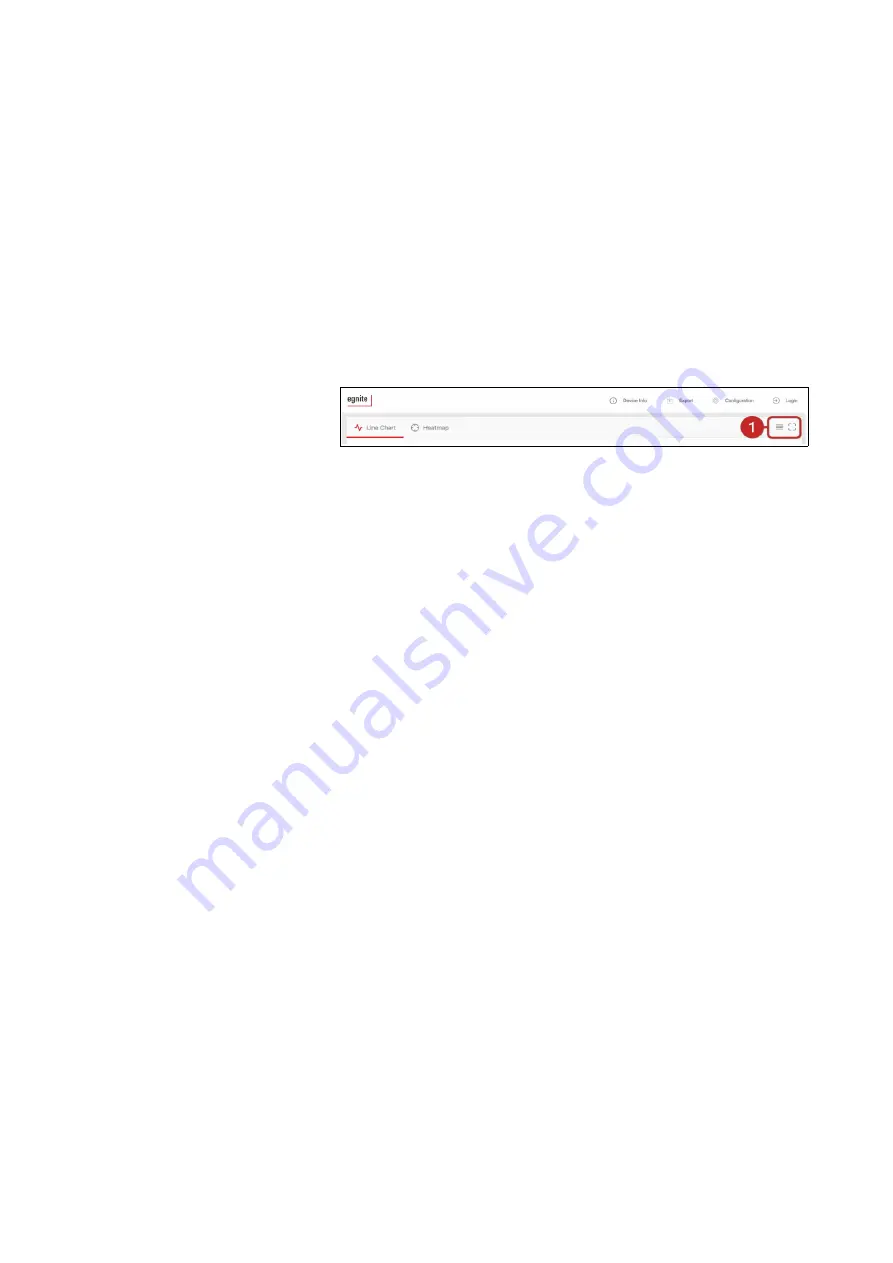
The home page’s
layout
can be customized via two
buttons
(1)
. The left button toggles the side bar on and
off, if the browser window’s width is 900 pixels or more.
If the window is less than 900 pixels wide, the button
toggles between the graph and the side bar. This
ensures that the most relevant data is always displayed
clearly.
The right button lets you switch into full screen mode,
which hides the task bar at the top and the info bar at
the lower edge of the browser window.
5.3 Device Information
You can open a field with further, general information
on this device by clicking the button
Device Info
in the
header.
51


