49
P
LOTTING
BATCHES
R
16 PLOTTING BATCHES
Note:
The instructions given in this section (16) apply to Elcometer 331 Model TH only. Users of
Elcometer 331 Model SH can upgrade their instrument to model TH to gain this functionality -
contact Elcometer or your local supplier for details.
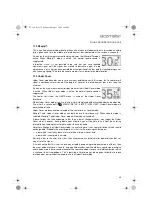
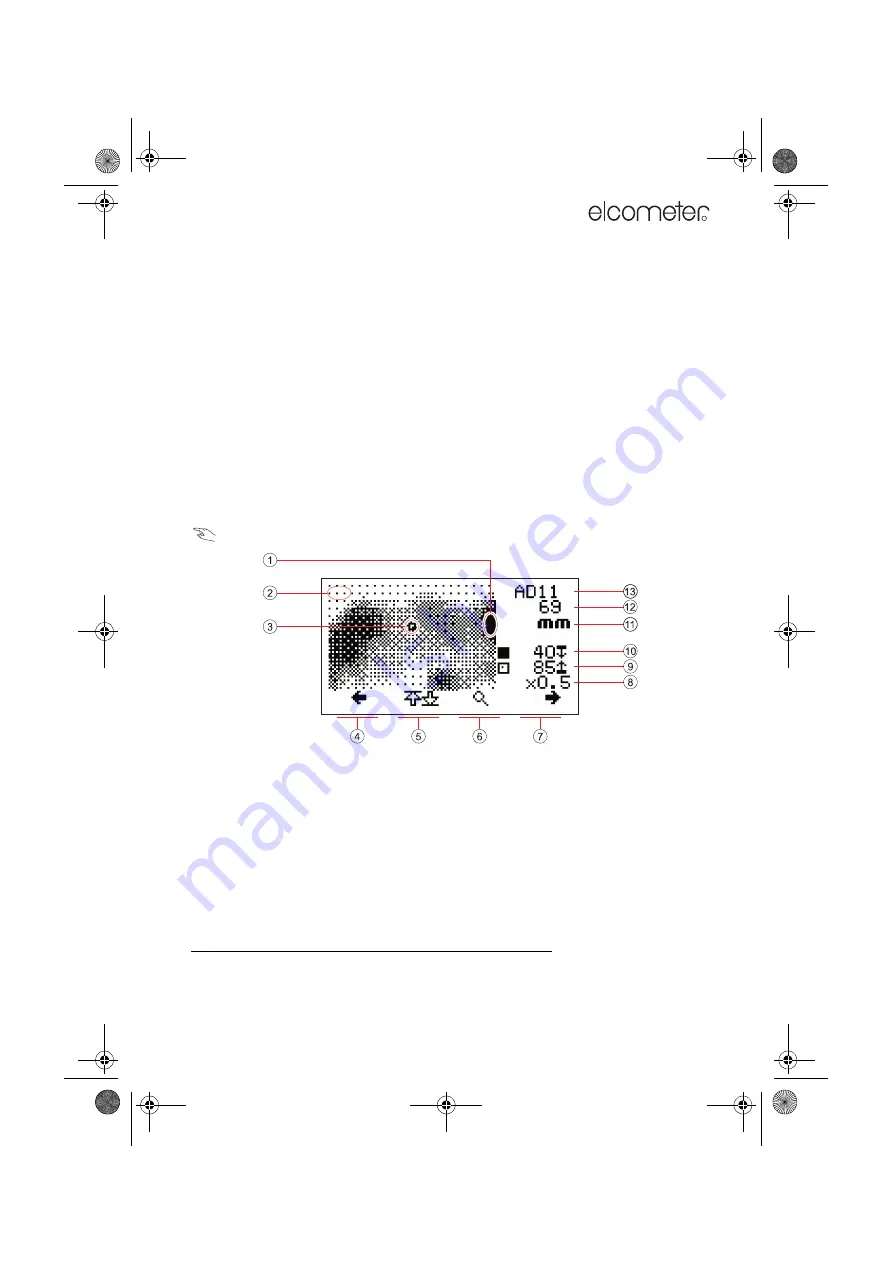
Your Covermeter can plot on its display a ‘map’ of the readings in a batch. Use this feature to locate
potential trouble spots quickly and easily.
The map can be plotted in pseudo greyscale or in black and white:
Greyscale:
The lowest (worst) readings are displayed as dark regions on the map; the highest
readings as light regions. 16 levels of greyscale indicate readings between these extremes.
Black and white:
A threshold value is set by the user. All readings below the threshold are
displayed as black; all readings above the threshold are displayed as white.
In both instances, blank and over-range readings are shown as white and under-range readings are
shown as black. To select greyscale or black and white, see “Plot options” on page 50.
16.1 Plot batch
MENU / DATA LOGGER / PLOT BATCH
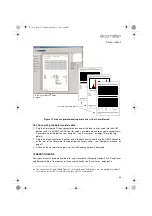
Figure 25. Typical greyscale plot (of concrete cover)
1. Dark area (
) - potential trouble spot
8. Zoom level
2. Light area (
)
9. Upper limit
3. Cursor position
10. Lower limit/Threshold
4. Cursor scroll
ag
left
11. Units
5. Shift scroll
ah
12. Concrete cover/Voltage
6. Zoom
ai
(0.5x, 1x, 2x, 4x magnification)
13. Batch memory location
7. Cursor scroll right
ag. To scroll up or down, use the up
[
]
and down
[
]
keys.
ah. Press with cursor scroll keys to jump to end or start of row/column
ai. When a batch is first plotted, the initial zoom is set automatically to the highest level that allows the whole
batch to be seen (or to x0.5 if the batch does not fit on the display at minimum zoom).
331.book Page 49 Thursday, March 12, 2009 9:46 PM

