30
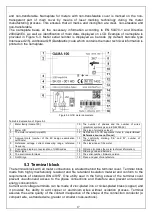
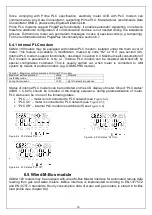
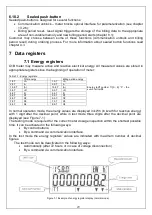
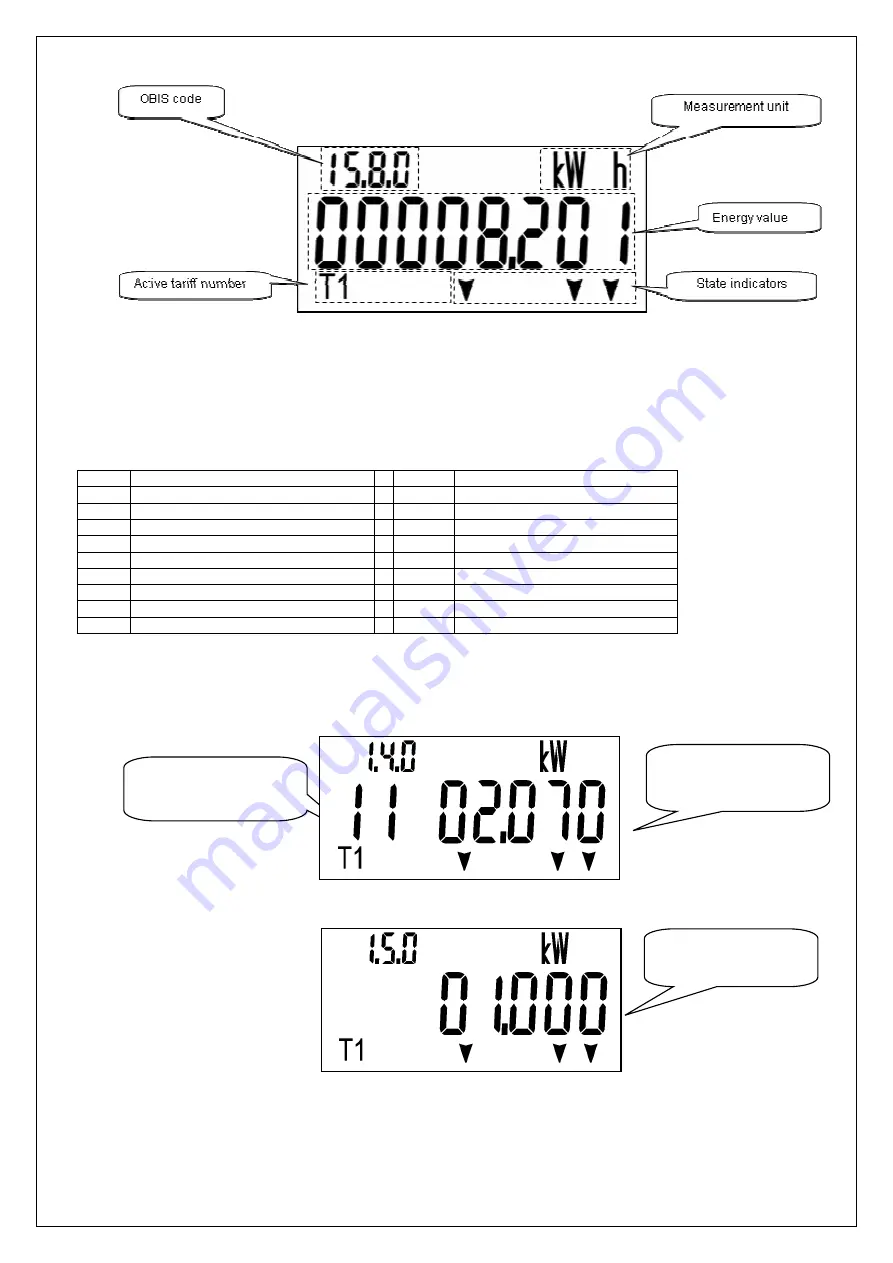
Figure 7-2 Example of energy register display (test mode)
7.2 Demand registers
G1B meter calculates average power over integration period and stores it in appropriate
registers:
Table 7-2 Demand registers
Demand of current integration period
Demand of last integration period
1.4.0
+P
1.5.0
+P
2.4.0
-P
2.5.0
-P
15.4.0 |P|
15.5.0
|P|
3.4.0
+Q
3.5.0
+Q
4.4.0
-Q
4.5.0
-Q
5.4.0
Q1
5.5.0
Q1
6.4.0
Q2
6.5.0
Q2
7.4.0
Q3
7.5.0
Q3
8.4.0
Q4
8.5.0
Q4
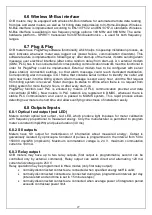
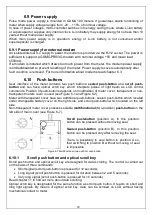
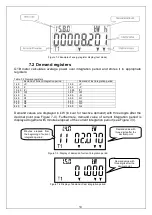
Demand values are displayed in kW (in kvar for reactive demand) with three digits after the
decimal point (see Figure 7-4). Furthermore, demand value of current integration period is
displayed together with minutes elapsed of the current integration period (see Figure 7-3).
Figure 7-3. Display of demand of current integration period
Figure 7-4 Display of demand of last integration period
Demand value with
three digits after the
decimal point
Minutes elapsed from
the beginning of current
integration period
Demand value with
three digits after the
decimal point
Summary of Contents for G1B Series
Page 2: ......


