PACEdge User Manual
Section 6
GFK-3178B
Nov 2020
PACEdge Usage Examples
21
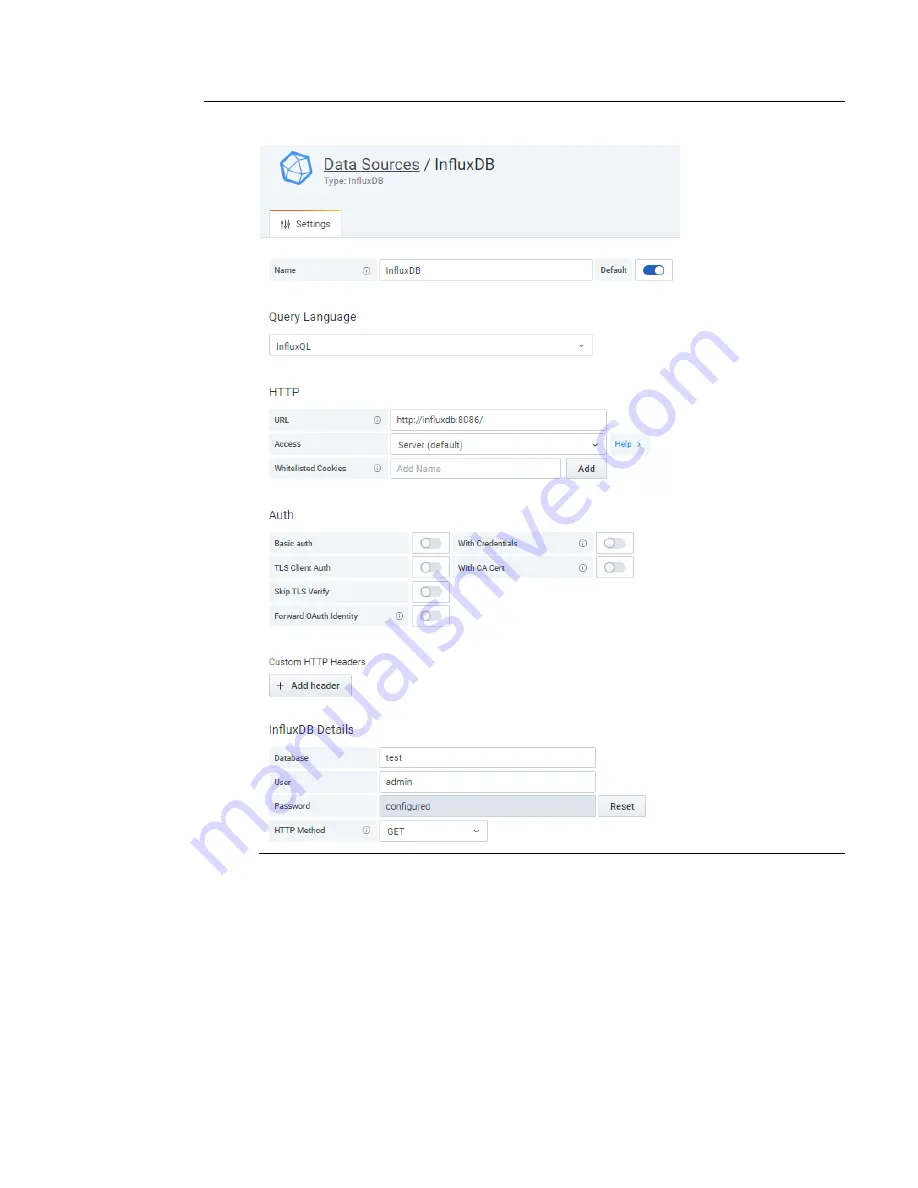
Figure 14: Configuration Screen for InfluxDB
4.
Click on Save & Test on the bottom, you should get the message Data source is working with
green background
5.
Click on Explore (on the left sidebar)
6.
Click on Select Measurement, and select test in the drop-down list.
7.
Below will pop up a graph.
8.
Create your Dashboard with the desired view configuration.


