72 Chapter 6 Web Page Of MSC-C
SmartCabinet Integrated Solution User Manual
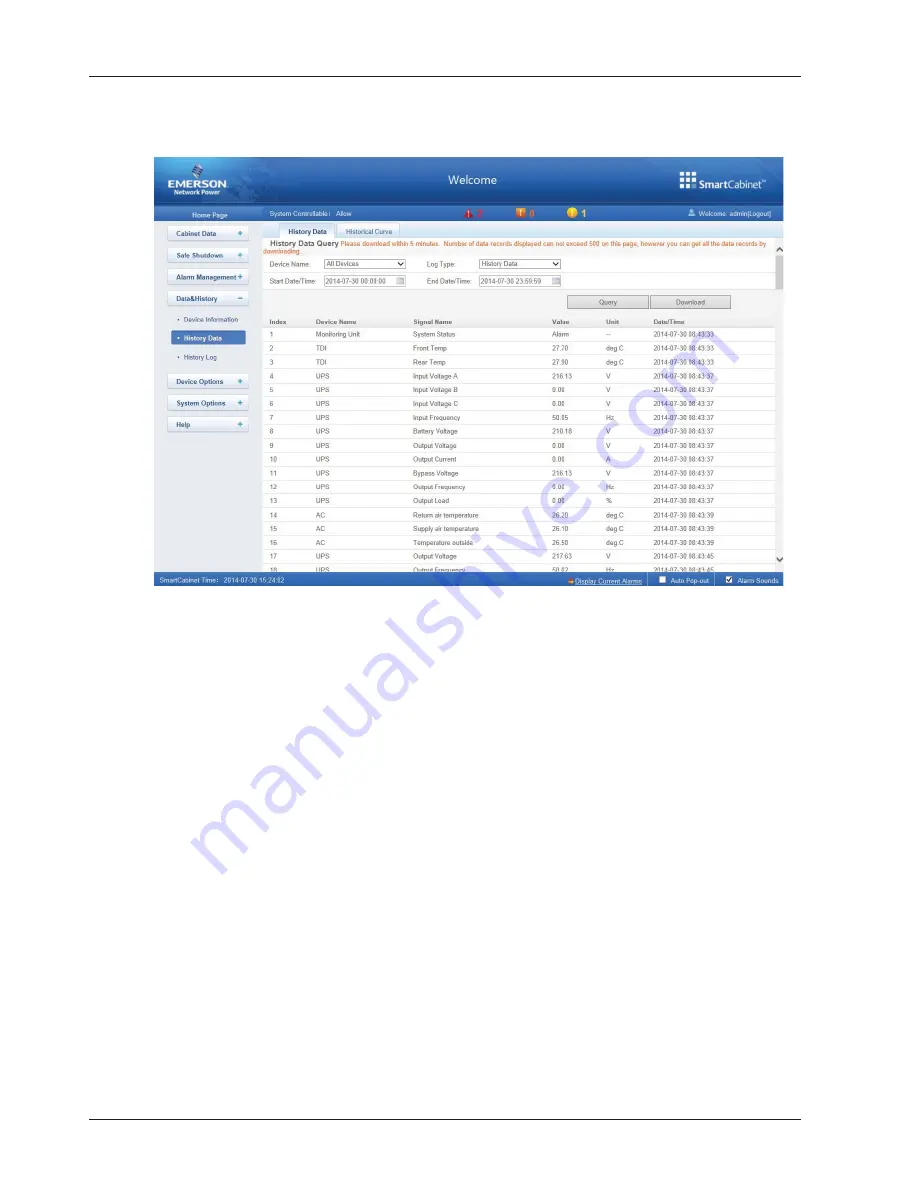
History Data
Click the
History Data
submenu under the
Data & History
menu, the page shown in Figure 6-38 pops up. The page
has two tabs:
History Data
and
Historical Curve
.
Figure 6-38 History data
1. History Data
As shown in Figure 6-38, choose a device (for instance,
‘
All Devices
’
) and the Log Type (for instance,
‘
History Data
’
),
and set the start time and the end time (for instance, from 2014-07-30 00:00:00 to 2014-07-30 23:59:59). Then click
the
Query
button, all the history data during the time will be listed, click the
Download
button to download the query
result.
2. Historical Curve
As shown in Figure 6-39, choose a device (for instance,
‘
TDI
’
) and the Log Type (for instance,
‘
Front Temp
’
), and set
the start time and the end time (for instance, from 2014-07-30 00:00:00 to 2014-07-30 23:59:59). Then click the
Show Curve
button, if history data are queried, a historical curve of the signal will be shown.


