48
Description Tab
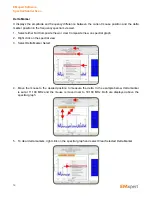
You can name the node and add a description. Click OK.
To run the scan once click
or to run the scan continuously click
.
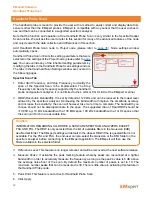
The progress bar on the lower right of the screen will indicate the progress of the scan. The system will
take a few more seconds for marking peaks (EMxpert rescans at a smaller span around the entire major
peaks to more accurately identify the peaks and mark them with a blue circle. This is done to overcome
the 1% to 2% of span spectrum analyzer error and to verify the existence of the peaks).
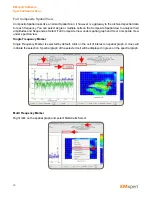
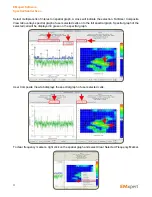
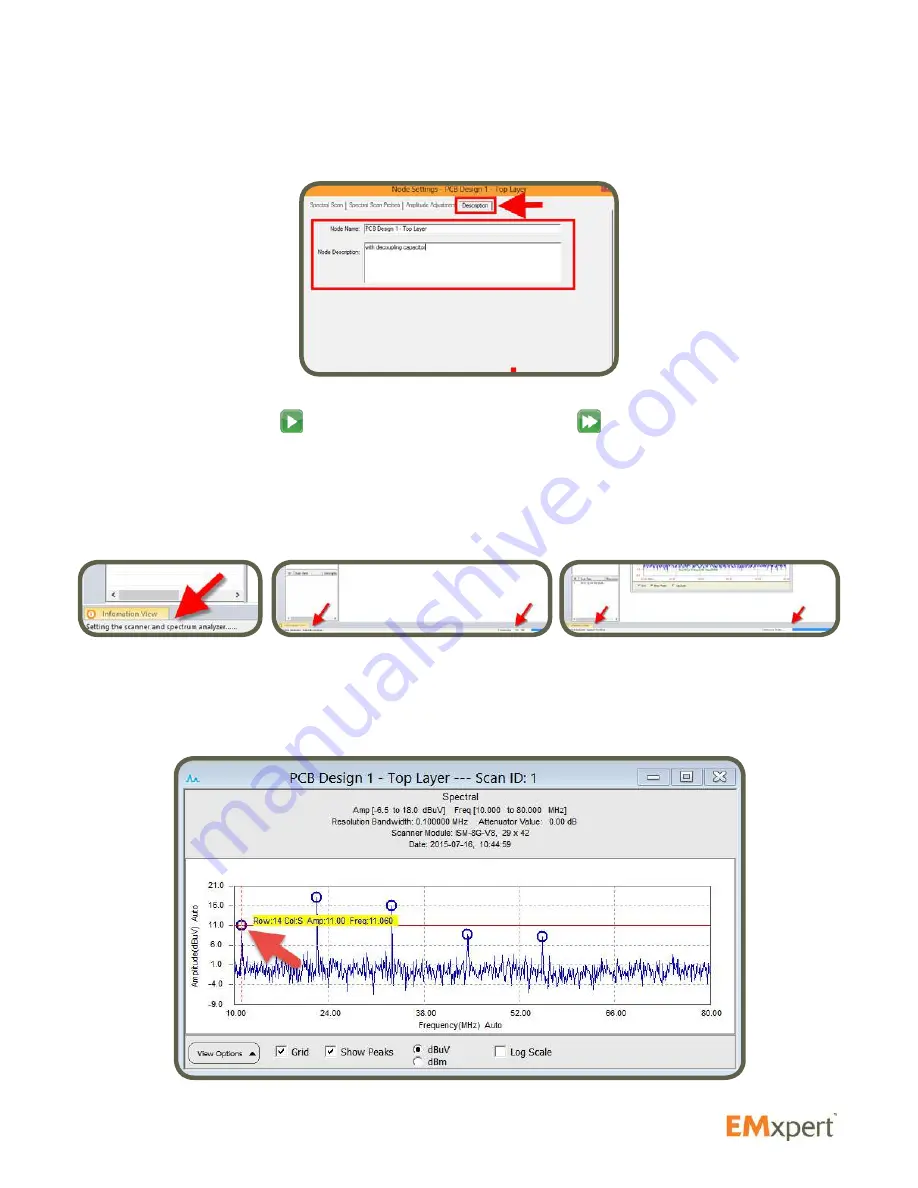
Once the scan is completed, an image of the scan will be displayed. You can mouse over the graph to
see coordinates, frequency and amplitude data.
EMxpert Software
Spectral Scan


