28
Viewing Scan Results
Depending on the scan type, you can view the scan results in either spectral or spatial or both views.
Spectral View
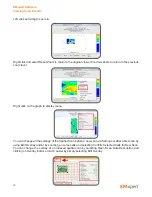
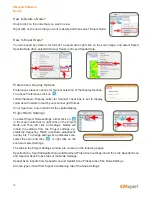
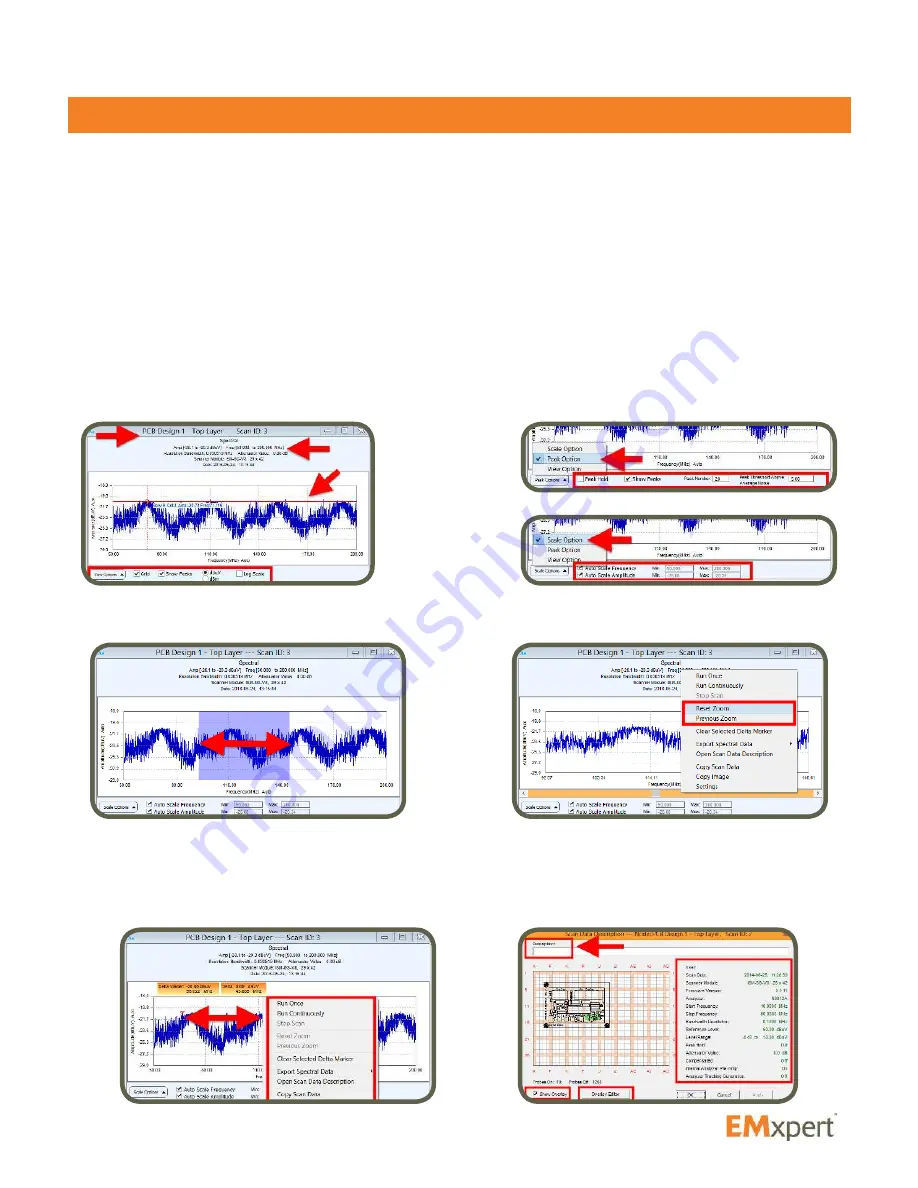
Name of the scan is on the top of the graph. Below the name is the scan type, scan frequencies, minimum
and maximum amplitudes of this span, LNA or Attenuator values used, patented scanner model and date
and time of the scan.
Mouse over the graph to display row / column coordinates, frequency and amplitude values.
A blue circle represents a user-defined marked peak. To select a peak, mouse over the peak and either
left-click the mouse or click the space bar on the keyboard.
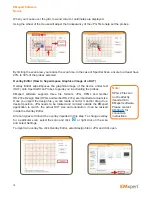
Spectral view can be adjusted by the checkmark boxes at the bottom of the graph. Grid and Peaks can
be hidden / displayed. Unit can be switched between dBuV and dBm. Linear scale is the default settings
of the graph. Log Scale can be selected. Peak and Scale Options are listed under View Options.
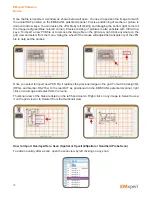
Left click and drag to zoom in. Right click and select Reset Zoom to return to the original view or Previous
Zoom to return to the previous zoom level.
A Delta Marker can be set by left clicking anywhere on the spectral graph. It displays the amplitude and
frequency difference between the current mouse position and the delta marker position.
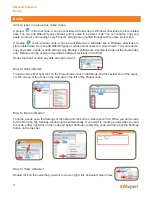
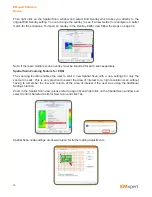
Right click on the graph to display menu. You can change some settings of the Spectral Scan via Settings
or Open Scan Data Description which will give information about the scan and access to Overlay Editor.
EMxpert Software
Viewing Scan Results

