User Manual
Slam Stick User Manual
Version No. 2.0
42
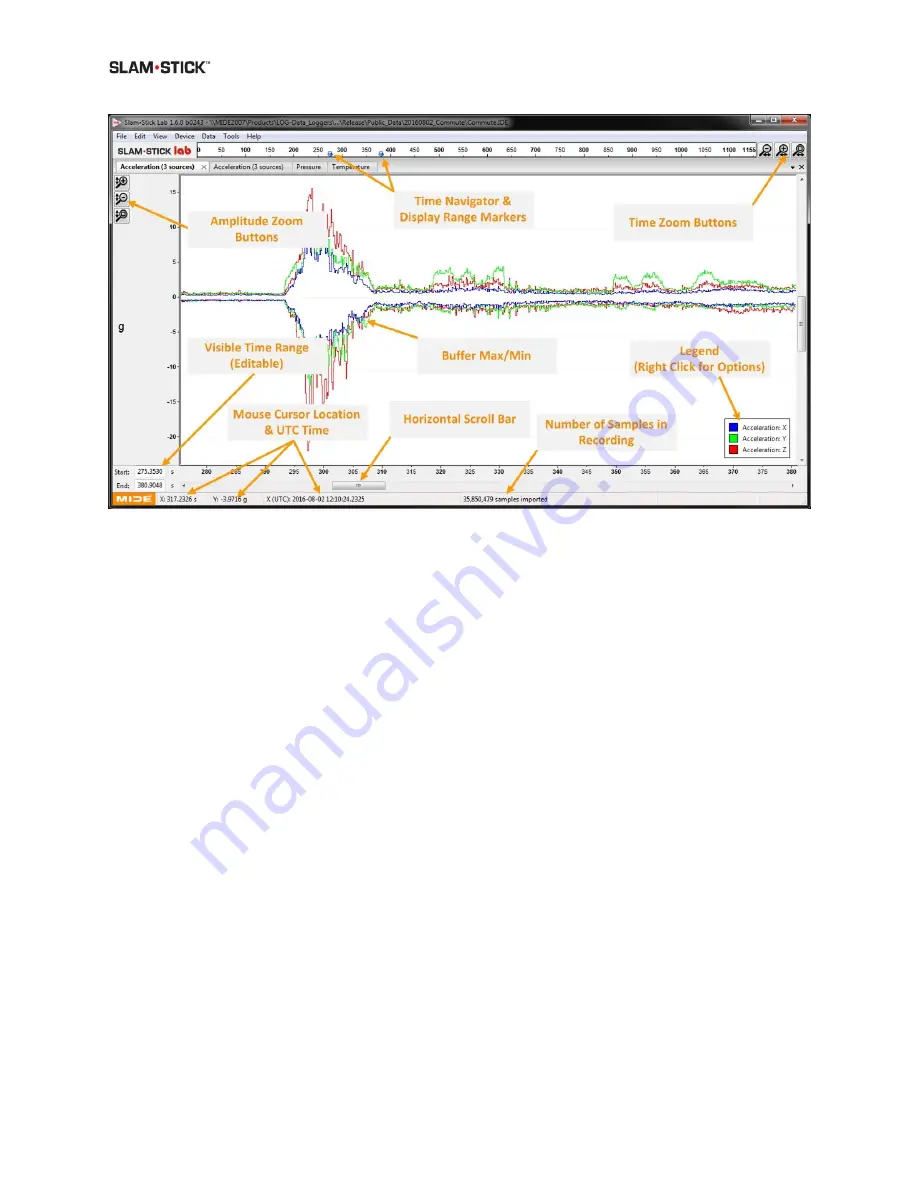
Figure 17: Various aspects and features of the plot window is identified.
Buffer Max and Min
The Slam Stick saves the minimum, maximum and mean of each “Buffer” of data that is written
to disk. A “Buffer” is about 4,000 data points, so the frequency of these is directly proportional
to the sampling rate. The Slam Stick Lab software enables the user to utilize the buffer
information in two ways. Buffer data is also utilized to help illustrate the moving maximum and
minimum acceleration level bands. The Slam Stick Lab does not plot every data point when
zoomed out for efficiency; so when zoomed out of a dataset it can appear that the vibrations
were less dense and/or less severe than in actuality. The Buffer Maximum and Minimum display
can help visualize how the maximum and minimum acceleration levels are changing with time.
This can be especially helpful when plotting data over a long time period.
When there are more buffers than the number of pixels on the screen, the Slam Stick Lab plots
just the buffer maximum and minimums. This is done to enable faster drawing times and to
provide a clear visualization on the acceleration data extremes.
Time Navigator & Display Range Markers
The top bar in the window (Time Navigator) shows the entire time of the recording with two blue
triangles (Display Range Markers) indicating the time period being shown in the current plot.
Horizontal Scroll Bar
The bottom scroll bar will keep the same spacing between the display range markers but allow
the user to finely scroll through the time domain.


