EN
DE
FR
FI
SV
RU
PL
CS
HU
SK
UK
SL
EL
HR
BS
SR
BG
RO
TR
15
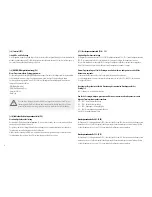
BMI
The Body Mass Index (BMI) is a result of
Weight (kg) / Height (m)
2
This value indicates if a person is normal-, over- or under weight . Your BMI can be calculated based on the values
in the charts below .
Normal BMI-values for age groups
Age group
Normal BMI
19 – 24 years
19 – 24
25 – 34 years
20 – 25
35 – 44 years
21 – 26
45 – 54 years
22 – 27
55 – 64 years
23 – 28
over 64 years
24 – 29
BMI-categories which differ from normal values
(based on the age group 19 – 24)
Category
BMI
severely underweight
< 15
underweight
< 17,5
borderline
< 19
normal
19 – 24
overweight
25 – 29
severely overweight
30 – 39
obese
40 >
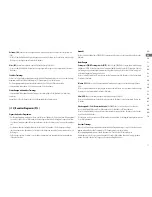
BMR
The Basal Metabolic Rate (BMR) is the amount of energy a body requires daily to sustain it’s basic function, as
measured while at complete rest for example while sleeping at a room temperature of 28° C .
Your actual energy consumption (performance volume) is found by multiplying the, calculated BMR-value with
the activity factor (see chart next page) .
Degree of activity
Activity factor
low activity
sedentary job, little to no exercise
1,2
normal activity
average job activity 1 – 2 hrs exercise weekly
1,3
moderate activity
average job activity, 3 – 4 hrs exercise weekly
1,4
active
strenuous job, 4 – 5 hrs exercise weekly
1,6
very active
strenuous job, > 5 hrs exercise weekly
1,9
!
You can also use this value to check your nutrition and possibly adjust it.
Good to average body fat proportion for age groups in %
Age group
Male
Female
19 – 24 years
13 – 20 %
21 – 25 %
25 – 34 years
15 – 22 %
21 – 26 %
35 – 44 years
18 – 24 %
23 – 29 %
45 – 54 years
20 – 26 %
26 – 33 %
55 and above
22 – 27 %
29 – 34 %
Body fat in %
The body fat in % (FAT %) is a value that determines the proportion of fat in relation to muscle .
Reference values for a good to average body fat proportion in reference to the age and gender can be found in the
chart below .
Body type
The percent of body fat calculated by the computer is assigned to 9 body types . They are differentiated by a lower
or higher value of body fat . The assignment is made in increments of 5 % .
Type Nr.
Body fat
1
5 % – 9 %
low body fat
2
10 % – 14 %
low to recommended body fat for men
3
15 % – 19 %
recommended body fat for men
4
20 % – 24 %
recommended body fat for women
5
25 % – 29 %
elevated body fat
6
30 % – 34 %
very elevated body fat
7
35 % – 39 %
per definition obese
8
40 % – 44 %
pronounced obesity
9
45 % – 50 %
massive obesity


