Hardware Required by the FRF Module
dataPAC User’s Guide
213
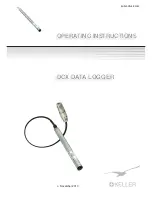
The force spectrum shows how the impact force is distributed across the spectral frequency
range. The graph above illustrates that as the frequency increases there is a steady decline in
the amount of energy at these frequencies. Without sufficient energy to excite the higher
frequencies, you cannot measure or determine if the structure is resonant at those higher
frequencies. Since the data at these higher frequencies may be noise, the FRF calculations,
which are a ratio of the input and output channels, can be misleading. When you are setting
up to collect FRF measurements, you should take a look at the force spectrum to determine
that the hammer and tip you are using is sufficient to measure the frequency range you have
selected.
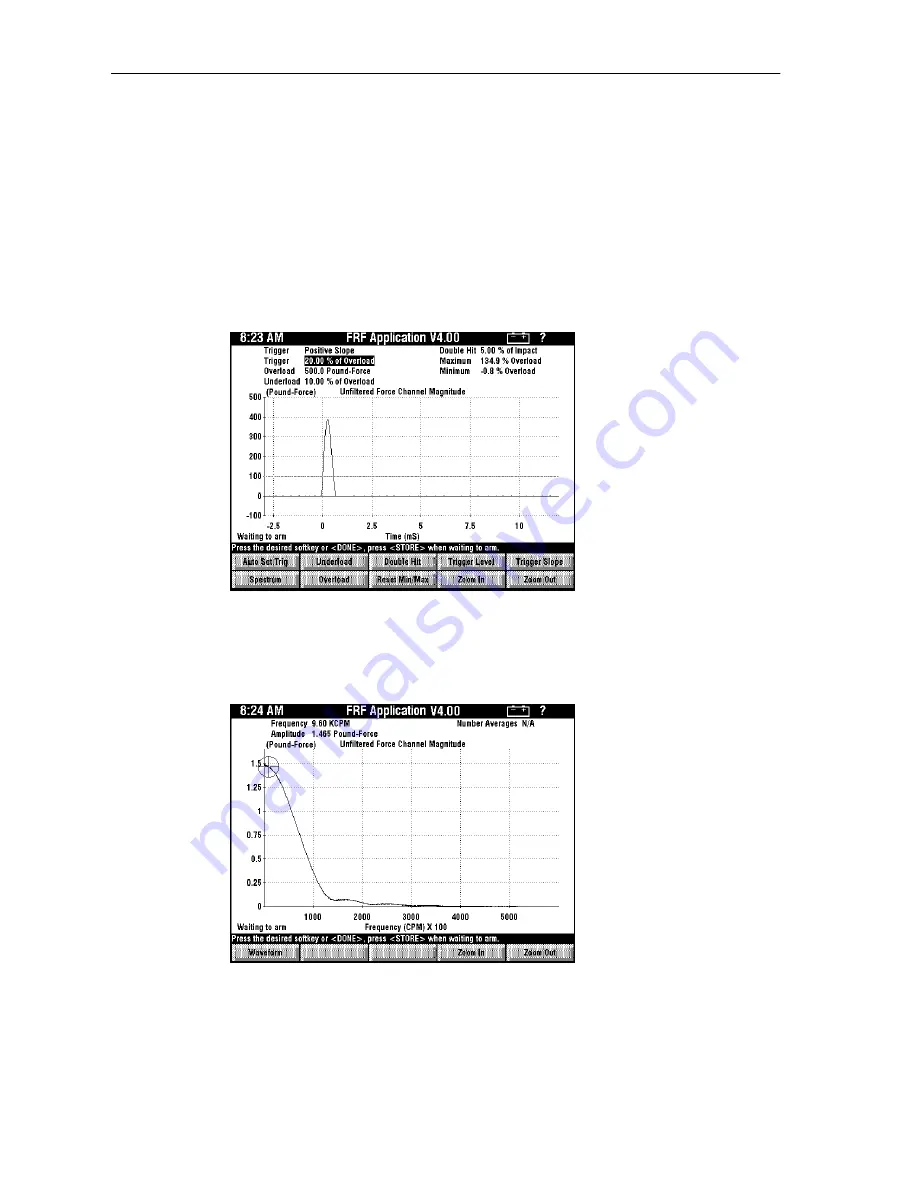
The following is a force waveform and spectrum with a plastic tip.
In the display above, the impact force is not quite as sharp as the steel tip even though this
measurement was taken with approximately the same impact force. This results in a slightly
longer pulse width due to the softer material. The next graph displays the spectrum of this
impact.
Artisan Technology Group - Quality Instrumentation ... Guaranteed | (888) 88-SOURCE | www.artisantg.com
Artisan Technology Group - Quality Instrumentation ... Guaranteed | (888) 88-SOURCE | www.artisantg.com


