218
dataPAC User’s Guide
Chapter 6 - Frequency Response Function (FRF)
Six Frequency Response Functions
The six response function tests provided in the FRF Module can be categorized two ways.
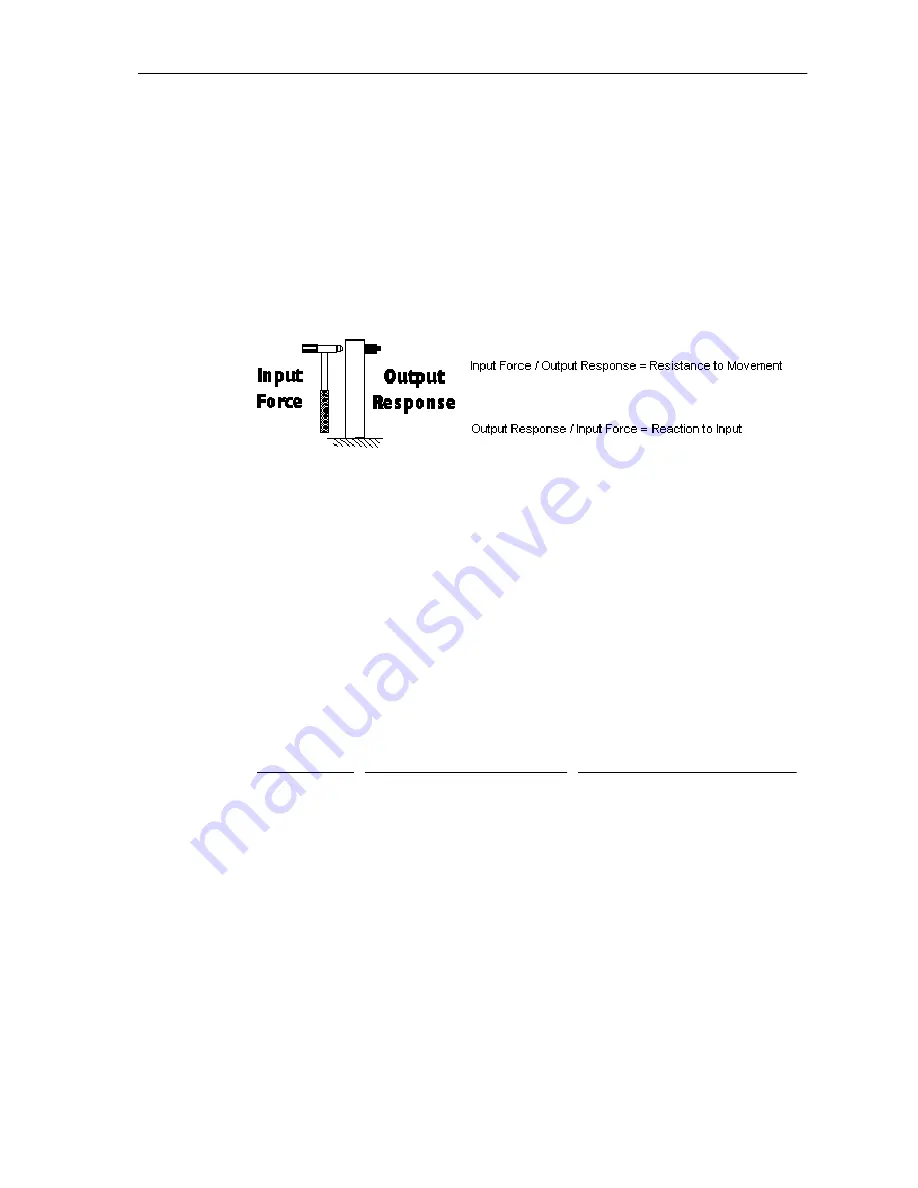
The most important characteristic is whether the test is measuring the ratio of the input to
the output or vice versa. Knowing which ratio a function uses is extremely important when
analyzing collected data, since you may need to look for “valleys” in the data instead of the
“peaks” normally significant in vibration analysis.
The functions that measure a structure’s resistance to movement use the input force divided
by the output response ratio. Since this number represents how resistant a structure is to an
external force, you must be concerned when this value is low. When the resistance to motion
is low, resonance is more likely to happen.
Conversely, the functions that measure how far a structure moves in relation to an input
force use the ratio of output response divided by input force. Since you are concerned with
large amounts of movement relative to a stable input force, you look for large amplitudes in
the data, much the same as conventional vibration analysis.
The second characteristic of each frequency response test is which physical unit of measure
it uses to quantify the output response level. The three possible units are acceleration,
velocity, and displacement. Since you use an accelerometer to measure the output response,
the instrument integrates the acceleration signal to compute velocity, or double integrates to
compute displacement.
The table below lists the six frequency response functions by the parameter each represents
and the ratio used. These are the function names you will see in the FRF Module for the data
types that can be used to display your collected frequency response data.
In addition to the six frequency response tests, you can also view the input or output data in
time waveform or spectrum plots as well as a coherence plot that describes the exact
relationship between the input force and the output response.
The coherence plot has an X axis in frequency units and a Y axis that represents the relative
coherence from 0 to 1. The more closely an amplitude in the response signal correlates to
the input force, the greater the coherence value. Each frequency bin in the spectrum of the
two signals has its own coherence value. This is a powerful tool to help you determine
whether data from response channel is a result of the input force (high coherence) or some
other external excitation or background vibration (low coherence).
Response
Measurement
Response/Impact Force
(Reaction)
Impact Force/Response
(Resistance)
Acceleration
Accelerance
Effective mass
Velocity
Mobility
Mechanical impedance
Displacement
Dynamic compliance
Dynamic stiffness
Artisan Technology Group - Quality Instrumentation ... Guaranteed | (888) 88-SOURCE | www.artisantg.com
Artisan Technology Group - Quality Instrumentation ... Guaranteed | (888) 88-SOURCE | www.artisantg.com


