Collecting and Analyzing FRF Data
dataPAC User’s Guide
235
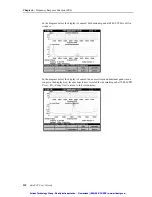
The following display shows the plot of Accelerance Phase on the top trace and Accelerance
Magnitude on the bottom trace. Note the 180 phase shift at resonant frequencies. In viewing
the phase plots, you need to be aware that the phase measurements near the axes can wrap
around to the other axis. You can see this wrapping in the phase plot below at approximately
14,000 CPM.
Artisan Technology Group - Quality Instrumentation ... Guaranteed | (888) 88-SOURCE | www.artisantg.com
Artisan Technology Group - Quality Instrumentation ... Guaranteed | (888) 88-SOURCE | www.artisantg.com


![Lambrecht power[cube] 30.95800.015000 Manual preview](http://thumbs.mh-extra.com/thumbs/lambrecht/power-cube-30-95800-015000/power-cube-30-95800-015000_manual_3388101-01.webp)


