80
dataPAC User’s Guide
Chapter 3 - Collecting and Reviewing Data
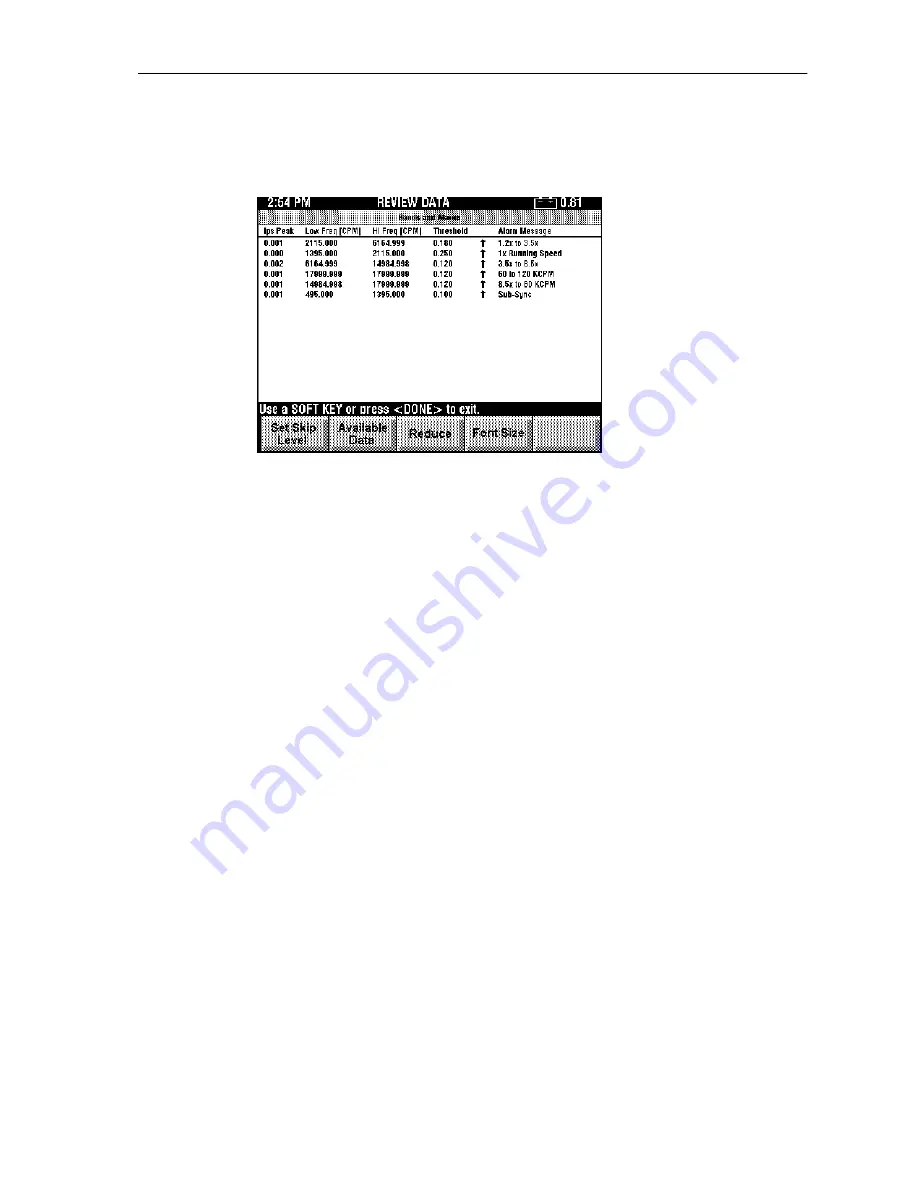
The band alarms are displayed as shown in the following diagram. Notice that the Magnify
view is selected. You can use the softkeys to change the display including Magnify/Reduce
and Font Size.
The magnitude value for the band’s frequency range is in the first column. The frequency
range is indicated in the next two columns. The threshold value is in the Threshold column.
An up arrow indicates an above alarm, a down arrow indicates a below alarm. The Alarm
Message is the text downloaded from your host software. In the diagram above the text was
downloaded from EMONITOR Odyssey or Enshare. If a measurement is in alarm, it has a
grey box around it in the magnified screen. During data collection, the name of the band
alarm is displayed if the measurement is in alarm.
Artisan Technology Group - Quality Instrumentation ... Guaranteed | (888) 88-SOURCE | www.artisantg.com
Artisan Technology Group - Quality Instrumentation ... Guaranteed | (888) 88-SOURCE | www.artisantg.com


