3. Using
the Software
IMU/USB Interface Board
SEIKO EPSON CORPORATION
9
Logger Software User’s Guide (Rev.20181129)
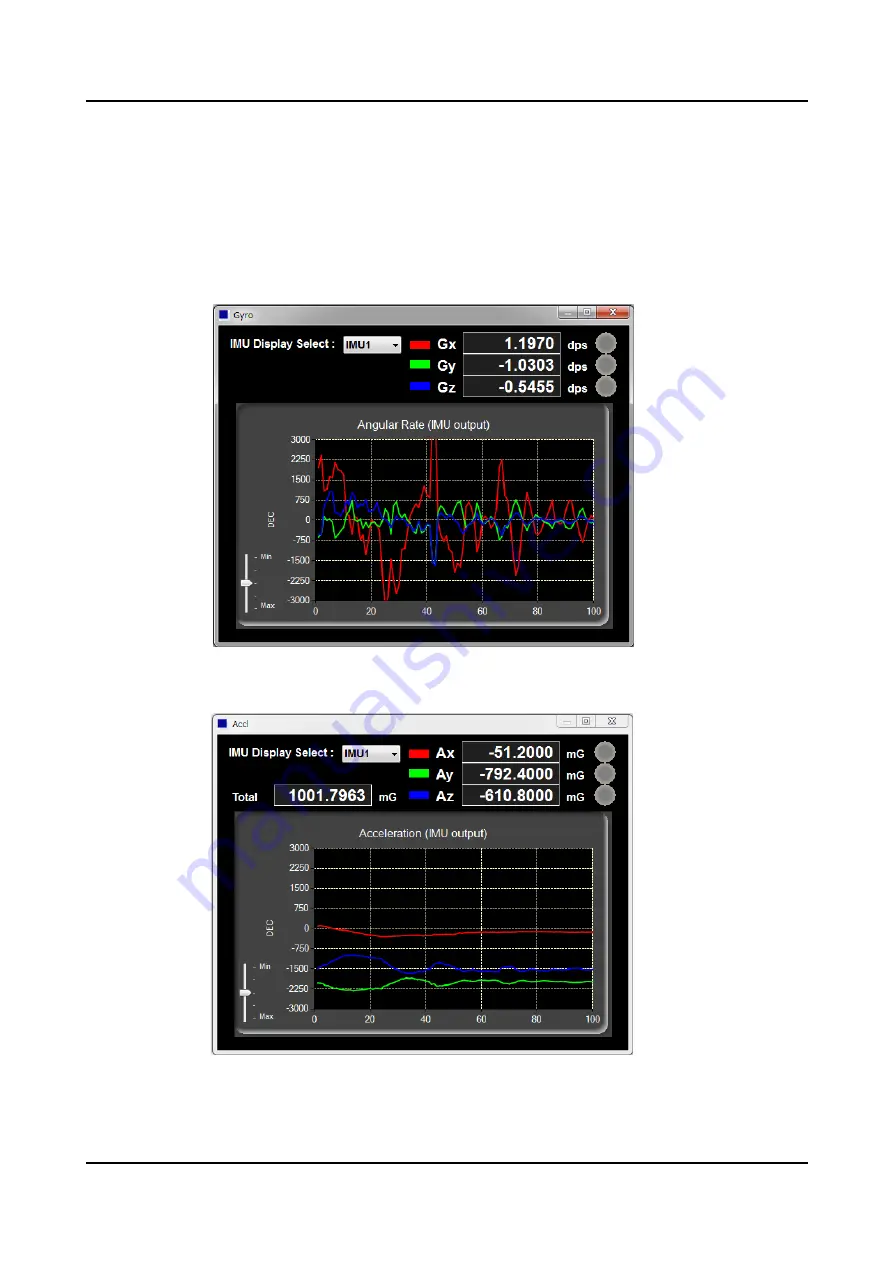
(4) The measurement data are displayed on the window. When “Show Gyro Graph” or “Show Accl
Graph” buttons are clicked, the specified plot graph is displayed. On the Graph window, the
measurement data are displayed as numerical values and as a line graph. In “IMU Display Select”,
select the IMU to display the measurement data for. To close the Graph window, click the close button
(×) at the upper right corner of the window.
Note: Displaying the Graph window requires significant processing resources from the PC. To put
more priority on log output, do not show the Graph window.
・
Screen Image of Gyro Graph
・
Screen Image of Accl Graph.
* When Overranging of a sensor axis is detected by the Software, the circle indicator located on the right side
of the affected sensor axis turns RED.
* The Graph can be enlarged by using slide bar on the right side of Graph.


