iLog User Guide
30
Readings and Summary
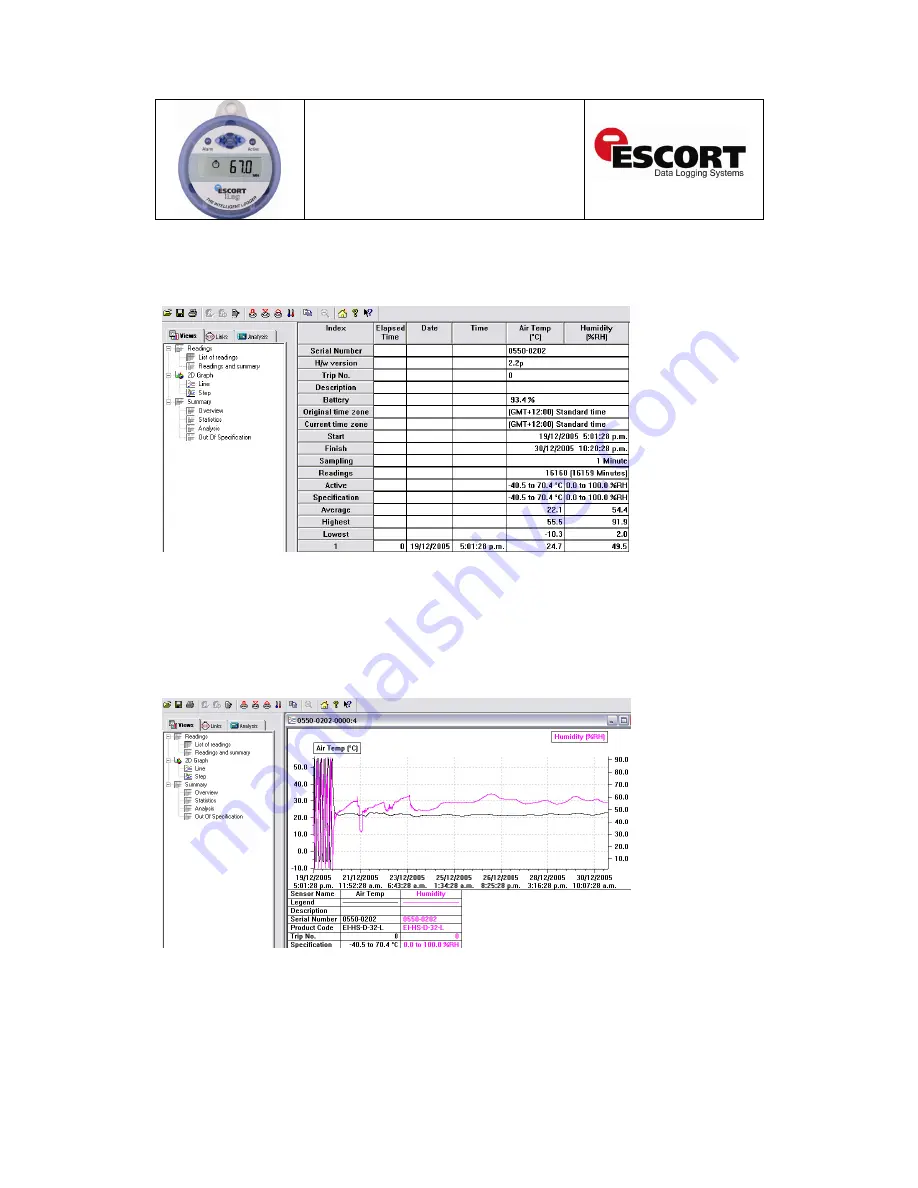
The second option under the readings menu is the readings and summary menu option. This is
the default menu option and displays all the information mentioned in the analysing your
downloaded information section on page 28.
Figure 3.5 Readings and Summary
2D Line graph
The first menu option under the 2D Graph menu is the line graph menu option. Here your logger
data is displayed in an easy to view format, with each sensor displayed in different colours and if
required your above/below specification limits and calibration limits are marked in different
colours. To customise the way in which you view your graphs please refer to the help files
supplied with your Console software.
Figure 3.6 Line Graph
Summary of Contents for iLog
Page 1: ......


