iMiniPlus PDF Logger User Guide v2.0
- 9 -
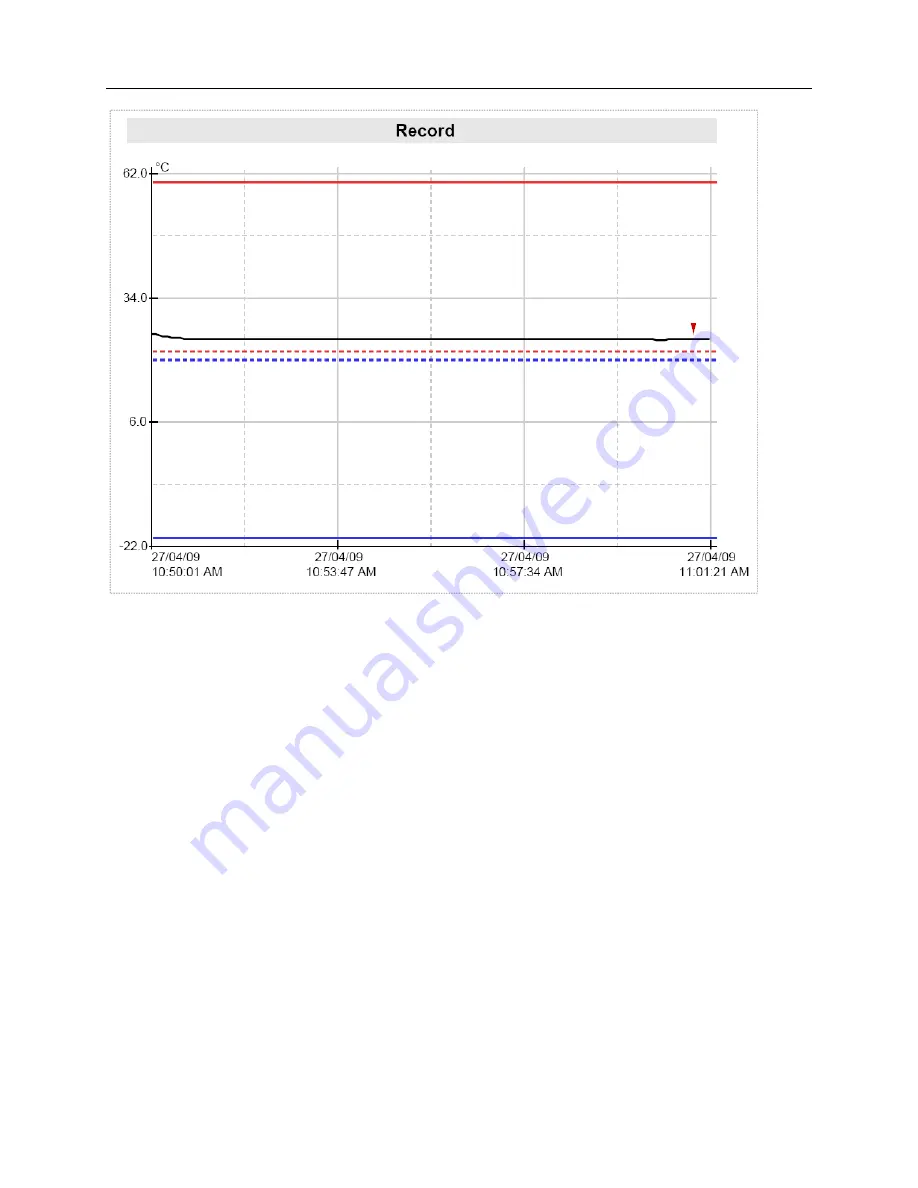
This part of the report is a graph of readings for the current trip.
This part of the report can be disabled when programming.
You can change date display format to display month first by programming logger.
Date and Time is displayed along the X axis.
Temperature values are displayed up the Y axis.
If Alarms are disabled Alarm limits are not displayed on the graph


