Solar Eye User Manual V1.0
Page 20 of 24
4.6 History Energy and Power Value Yield View
Call up HISTORY menu, you press “right” button to view history data by
switching the unit of Y axis among “Hour”“Day”“Week”“Month” and “Year”
by pressing “right” button. Operation process show as below:
1)
Hour
:
Press “right” button, you can view the energy and power
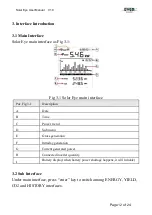
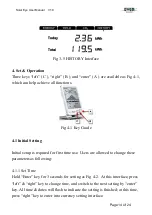
values/hour of last 34 hours yield by your PV system, Shown as in “Fig 3-1”
“B” means the time you check, ”F” means energy and power values yield in
this hour.
2)
Day
:
Press “right” button, you can view the energy and power values/day
of this day yield by your PV system, Shown as in “Fig 3-1” “A” means the
data you check, ”F” means energy and power values yield in the day.
3)
Week
:
Press “right” button, you can view the energy and power
values/week of last 34 weeks yield by your PV system, Shown as in “Fig 3-
1” “B” means the week you check, ”F” means energy and power values yield
in this week.
4)
Month
:
Press “right” button, you can view the energy and power
values/month of last 34 months yield by your PV system. Shown as in “Fig
3-1” “A” means year you check, ”F” means energy and power values yield in
this month.
5)
Year
:
Press “right” button, you can view the energy and power values/year
of last 4 years yield by your PV system. Shown as in “Fig 3-1” “A” means
year you check, ”F” means energy and power values yield in this year.

