4.3.4
Echosounder Display Tab
The
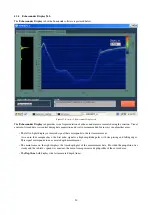
Echosounder Display
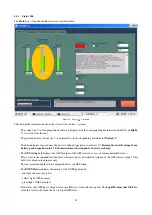
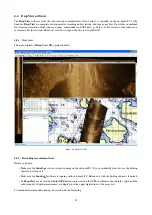
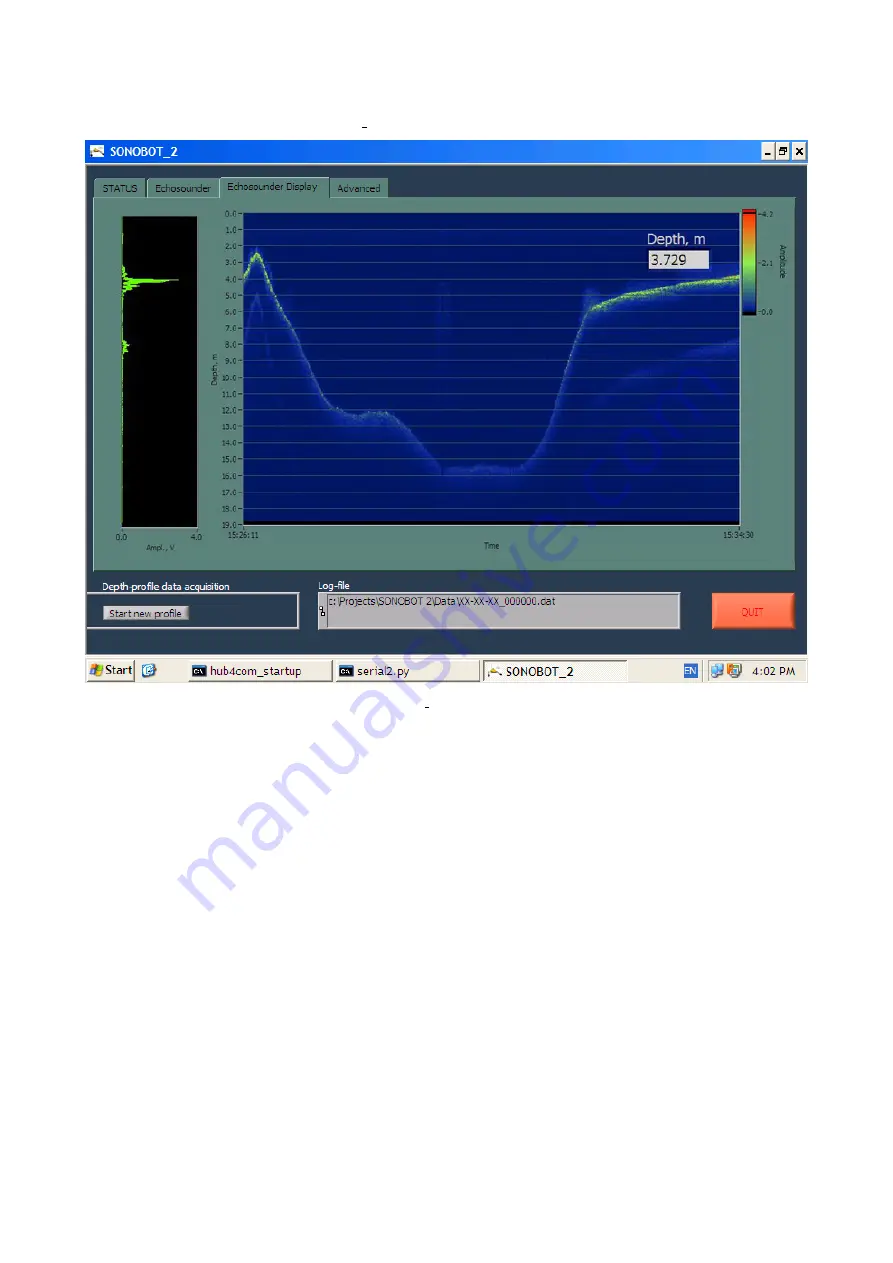
tab of the Sonobot 2 software is pictured below:
Figure 57: Sonobot 2: Echosounder Display tab
The
Echosounder Display
tab provides visual representation of echo-sounder measurements during the mission. Visual
control of stored data is essential during data acquisition and is also recommended for surveys in unfamiliar areas.
• The left sub-plot displays a received signal that corresponds to the last measurement.
As seen in the example above, the first echo signal is a high amplitude pulse with steep rising and falling edges.
This signal corresponds to an accurate depth measurement.
• The main frame on the right displays the time-depth plot of the measurement data. Provided the propulsion was
steady and the vehicle’s speed was constant, the main frame presents a depth profile of the covered area.
• The
Depth, m
field displays the last measured depth (in m).
50


