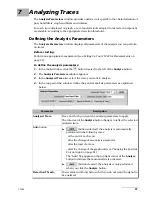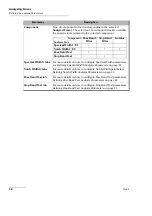
Displaying and Operating Scan Traces on Graph
56
CT440
Handling Traces
Handling Traces
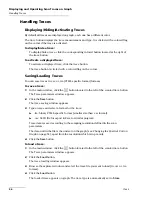
Displaying/Hiding/Activating Traces
By default all traces are displayed on graph, each one has a different color.
The trace button displays the trace measurement and type. It is circled with a colored flag
on the corner if the trace is activated.
To display/hide a trace:
To display/hide a trace, click the corresponding colored button located at the right of
the trace button.
To activate a displayed trace:
To activate a displayed trace, click the trace button.
The trace button is circled with a colored flag on the corner.
Saving/Loading Traces
You can save traces in .csv, or .tra (CT440 specific format) formats
To save a trace:
1.
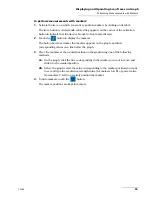
In the main window, click the
button located to the left of the wanted trace button.
The Trace parameters window appears.
2.
Click the
Save
button.
The trace saving window appears.
3.
Type a name and select a format for the trace:
.tra: binary CT440-specific format (smaller size than .csv format).
.csv: ASCII file for export in Excel or similar program:
Trace data is saved according to the sampling resolution defined in the scan
parameters.
The data unit in the file is the unit set on the graph (see
on page 54), apart from the resolution which is in pm only.
4.
Click the
Save
button.
To load a trace:
1.
In the main window, click the
button located to the left of the wanted trace button.
The Trace parameters window appears.
2.
Click the
Load
button.
The trace loading window appears.
3.
Browse the explorer window and select the trace file you want to load (in .csv or .tra
format).
4.
Click the
Load
button.
The loaded trace appears on graph. The trace type is automatically set to
Store
.
Summary of Contents for CT440 Series
Page 1: ...User Guide CT440 Passive Optical Component Tester www EXFO com...
Page 6: ......
Page 30: ......
Page 96: ......
Page 162: ......

