Analyzing Traces
CT440
75
Displaying and Understanding the Analysis Results
Displaying and Understanding the Analysis Results
In the main window, the
Analysis Results
tab under the graph provides the results of the
analysis.
Before starting:
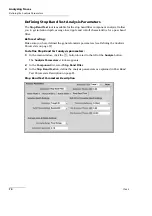
Make sure you have configured the analysis parameters according to your needs as
explained in
Defining the Analysis Parameters
on page 57. The trace number selected for
analysis appears on the
Analyze
button.
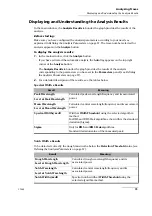
To display the analysis results:
1.
In the main window, click the
Analyze
button.
If you have activated the automatic analysis, the
Auto
flag appears on the top right
corner of the
Analyze
button.
The
Analysis Results
tab under the graph provides the results of the analysis
corresponding to the parameters you have set in the
Parameters
panel (see
2.
For a detailed description of the results, see the tables below.
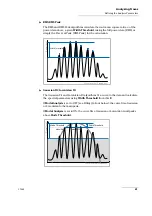
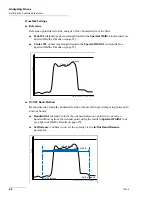
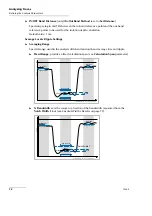
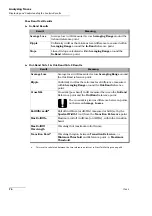
Spectral Width x Results
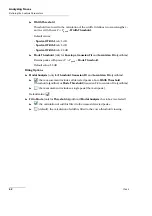
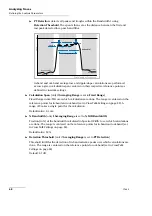
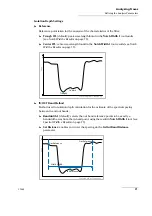
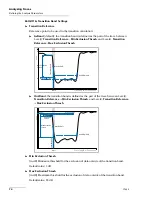
Notch Width x Results
To be detected correctly, the trough must not be below the
Detection Threshold
value (see
Defining the Analysis Parameters
Result
Meaning
Peak Wavelength
Calculated peak wavelength/frequency and its associated
power.
Level at Peak Wavelength
Mean Wavelength
Calculated central wavelength/frequency and its associated
power.
Level at Mean Wavelength
Spectral Width@xxdB
Width at
Width Threshold
using the selected algorithm
method.
For RMS and RMS Peak algorithms, the width is the standard
deviation (Sigma).
Sigma
Only for
RMS
and
RMS Peak
algorithms.
Standard deviation value of the measured peak.
Result
Meaning
Trough Wavelength
Calculated trough wavelength/frequency and its
associated power.
Level at Trough Wavelength
Notch Wavelength
Calculated central wavelength/frequency and its
associated power.
Level at Notch Wavelength
Notch Width@xxdB
Spectral notch width at
Width Threshold
using the
selected algorithm method.
Summary of Contents for CT440 Series
Page 1: ...User Guide CT440 Passive Optical Component Tester www EXFO com...
Page 6: ......
Page 30: ......
Page 96: ......
Page 162: ......

