CT440
53
6
Displaying and Operating Scan
Traces on Graph
The graph area tab displays the scan results measured by the CT440 and enables you to
manage scans and traces.
The left scale in dB applies to the transfer function measurement.
The right scale depends on the trace displayed on graph:
If the trace displays a PDL measurement, the right scale is in dB
If the trace displays the voltage measured at the
Analog In
BNC input port, the right
scale is in Volts.
Adjusting the Graph Display
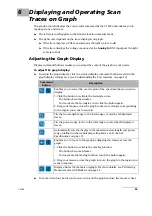
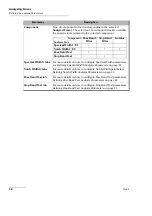
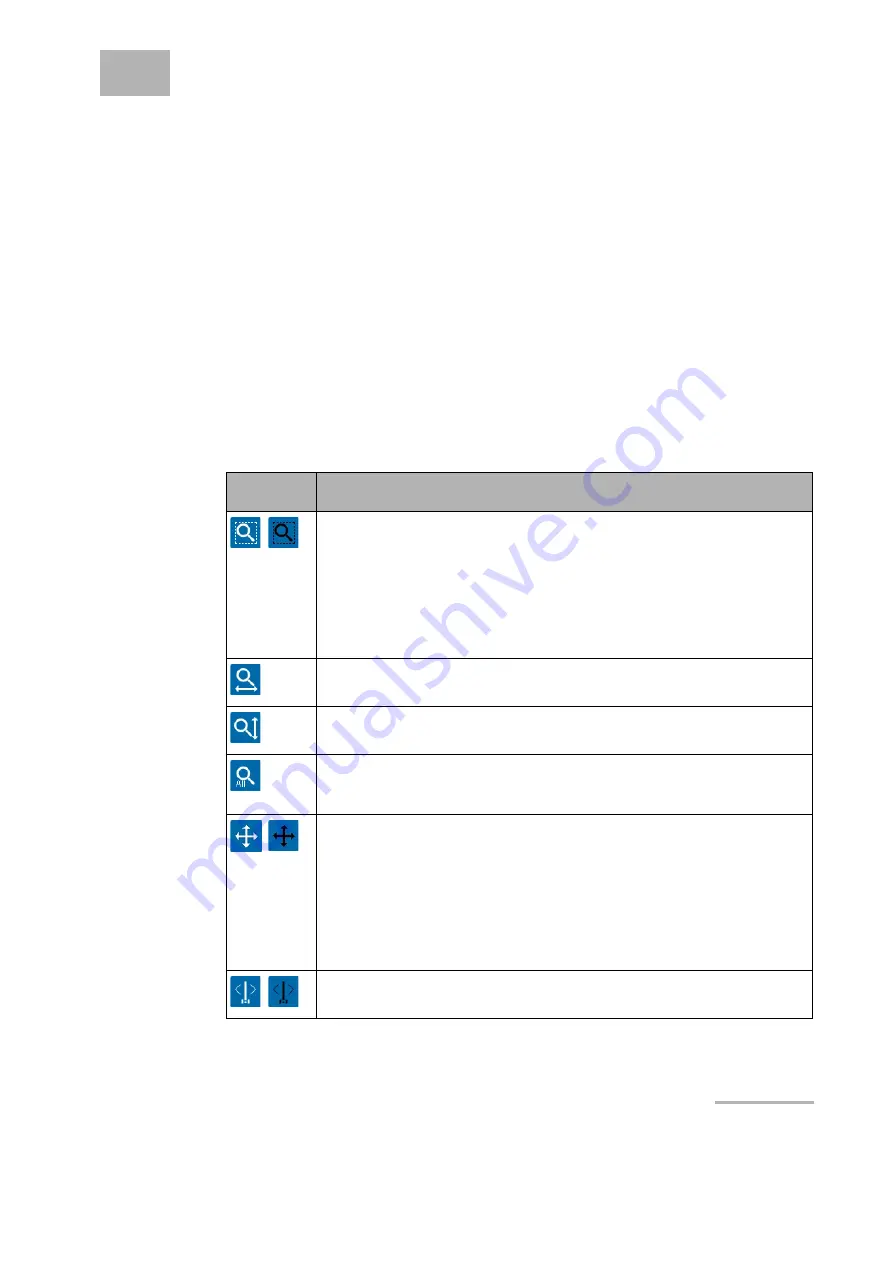
Display command buttons enable you to adapt the scale of the graph to your needs.
To adjust the graph display:
To adjust the graph display, click the wanted display command button located in the
graph display settings area (see
Understanding the User Interface
To zoom in and out, point your mouse cursor on the graph and use the mouse wheel.
Command
Button
Description
Enables you to select the exact region of the spectrum that you want to
display:
1. Click the button to activate the rectangle zoom.
The button becomes darker.
To deactivate the rectangle zoom, click the button again.
2. Drag your mouse across the graph to draw a rectangle corresponding
to the region you want to zoom in.
Fits the wavelength range to the total range covered by all displayed
traces.
Fits the power range to the to the total range covered by all displayed
traces.
Automatically sets the display to the maximum wavelength and power
range (defined in the technical specifications, see
Enables you to move in the graph by dragging the mouse across the
graph.
1. Click the button to activate the moving function.
The button becomes darker.
To deactivate the moving function, touch the button again.
2. Drag your mouse across the graph to move the graph to the region you
want to explore.
Displays/Hides the markers on graph. For more details, see
Summary of Contents for CT440 Series
Page 1: ...User Guide CT440 Passive Optical Component Tester www EXFO com...
Page 6: ......
Page 30: ......
Page 96: ......
Page 162: ......


