Impulse Tests
282
FTB-610
Impulse Duration
Impulse Duration
The
Impulse Duration
is a histogram displaying the distribution of
different captured impulse durations (widths) over a period of time. This is
very useful if different types of impulse noises are occurring at different
times. It also provides a
Disruption
graph showing the total accumulated
durations of impulse events over a period of time.
Impulse Duration
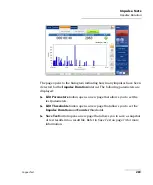
On the
Impulse Duration
page, the test histogram plots impulse
Counts
(y-axis) vs.
Impulse Duration
(x-axis), showing the distribution of different
duration impulses over time. This is key to understand when short events
such as REIN occur, versus longer events (PEIN) or short high impulse
noise events (SHINE). The page also records the
Elapsed Time
,
Total
Counts
, and pass/fail status. The test displays and updates results in
real
time
, for the length of time set in
Test Duration
or less, if you stop the test.
The last valid results then remain displayed.
To access the Impulse Duration page:
1.
From the
Copper
main menu
Test Groups
, select
Impulse
test
.
2.
From the
Tests
menu, select
Impulse Duration
to open the page and
start the test.
3.
Use the graph controls to maneuver the graph. Refer to
on page 19 for more information.

