Analyzing Traces with the Bidirectional Analysis Application
OTDR
207
Viewing Results
³
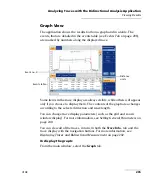
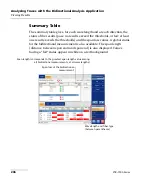
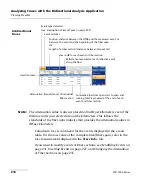
When you select an element from the summary table (or if you switch
to another wavelength or direction), the graph, as well as the contents
of the
Events
and
Trace Info.
tabs are updated accordingly.
³
In the summary table, when you select an element having a “fail”
status (element is highlighted), if you press
Locate
, the application
automatically switches to one of the following:
³
the graph view: The application zooms in on the first event or fiber
section for which the status is “fail”.
³
the
Trace Info.
tab: The application highlights the row
corresponding to the first element (span loss, span length, or span
ORL) for which the status is “fail”.
³
You can press the
Details
button for further information on the
element having a “fail” status.
Note:
Instead of pressing the
Locate
button, you can double-tap the element
having a “fail” status.
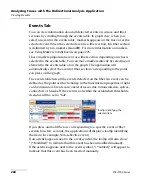
If you do not see any status (pass or fail), this probably means that no
threshold was selected (see
that the only threshold that is selected is
Fiber section attenuation
, but the
fiber sections are hidden (see
To display the summary table:
From the main window, select the
Summary
tab.

