RFC 2544 Tabs
322
IQS-8500 Series and IQS-8120NGE/8130NGE
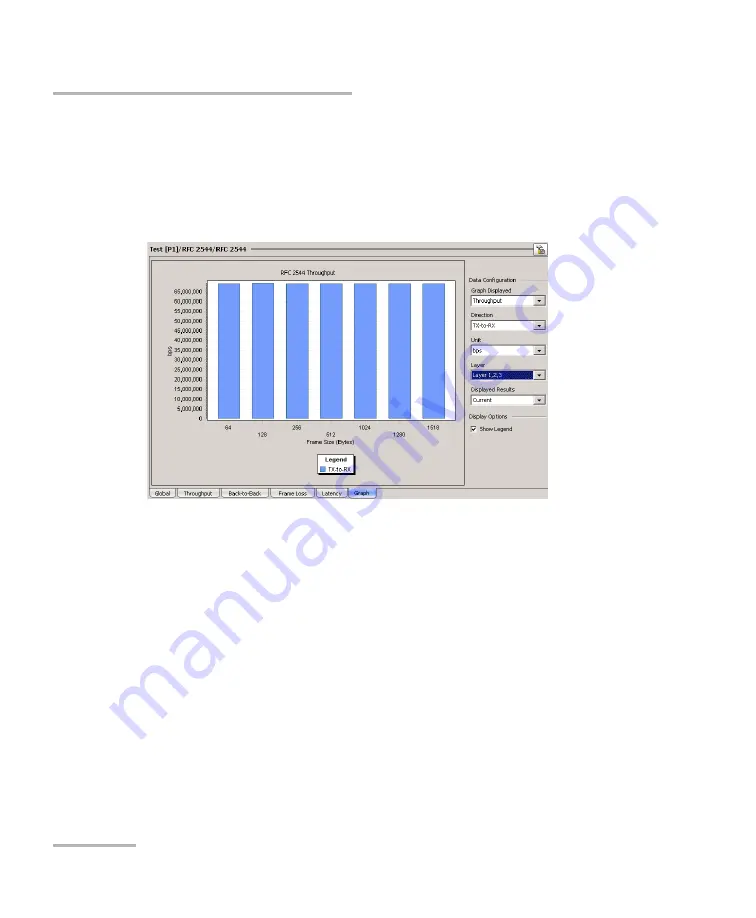
Graph
Graph
Gives the graph showing the Throughput, Back-to-Back, Frame Loss, or
Latency measurement.
Press
TEST
,
RFC 2544
, and
Graph
.
The X axis shows the frame sizes for
Throughput
,
Back-to-Back
,
Latency
or the
TX Rate
for
Frame Loss
. The Y axis shows the subtest results.
Data Configuration
Graph Displayed
: Select the test that has to be displayed. Choices are
Throughput
,
Back-to-Back
,
Frame Loss
, and
Latency
.
Direction
: Allows the selection of the test traffic direction. Choices are:
TX-to-RX
for single port topology (IQS-8510B)
P1-to-P2
,
P2-to-P1
, and
Bidirectional
for dual ports topology
(IQS-8510B)
Local to Remote
,
Remote to Local
, and
Bidirectional
for dual test set.


