Configuring Tests
Viewing Test Results
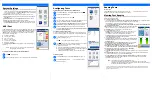
Once a test has run, the results obtained are displayed on the screen. Select the following tabs to view
pass/fail status and results details:
To setup an AutoTest, Manual Test, or Ethernet Test:
From the
DSL Main
pane, select
Test Configuration
and press
.
1
Select
Profile Details
and press
.
2
3
To change or create a new profile:
At power up, settings are read from the last loaded profile. If any changes are
made to the parameter values, you can save them to an existing or new profile.
Press
from any setup screen to display the dialogue box asking you
to confirm and save changes using the following buttons:
Save
to current profile.
Save as
displays a
New profile name
alphanumeric editor screen.
No
does not save any changes to the profile, closes the dialogue box,
and returns to
Profile Details
sub menu.
Cancel
closes the dialogue box and returns to the setup screen.
To select a profile:
From the
DSL Main
pane, select
Test Configuration
and press
.
Select the desired test setup and press
.
You can configure the test parameters from the setup fields found on the
following tabs:
Connection Setup
,
Thresholds
,
LAN Setup
.
On any test setup screen, scroll through and set the options using the
up/down and left/right arrow keys;
OR
Press
on any value to open a list box of options.
Choose
Select Profile
and press
. A list of available profiles is
displayed in a list box.
Running Tests
To run a test:
From the
DSL Main
pane, select the desired test icon and press
. The test automatically runs. In the
desired test, you can also press the Start/Stop key to run the test.
4
Connection Summary
includes:
(
for Auto and Manual Test)
Profile
,
Sync Time
,
Line Status
,
Operation Mode
, and upstream/downstream
SNR and Max Bitrate. You can select a new
Profile
from within the test results.
If optional Bonding on unit, data for pair 1 and pair 2 is displayed.
(for Ethernet)
WAN
/
LAN Port Line Status
/
Link Speed
/
Connect Mode
, and
Received
/
Transmitted
Total
Bytes
/
Packets
/
Ethernet Errors
.
WAN Status
shows connection status of the wide area network. In
Manual
Test
, you can also select which triple-play test you want to run or view.
LAN Status
shows connection status of the local area network.
If optional
VoIP Test
is on the unit:
VoIP Call
allows you to place and receive VoIP calls, and displays
Call
Information
such as the
VoIP Status
, number and Codec the call is
connected to, duration, and the pass/fail status of the test/call.
VoIP Summary
displays measurement details of the different parameters
including
MOS
,
R-Factor
,
Latency
,
Jitter
, and
Packets
.
If optional
IPTV Test
is on the unit:
Join Leave
lists IPTV channels from the alias table and measured
Zap
time.
IPTV Summary
displays test results of the IPTV streams, Join/Leave, and
Channel Analysis
.
DSL Param Details
include
Downstream
/
Upstream
results for Data rates,
SNR
,
Attenuation
,
Capacity
,
Output Power
,
Latency
,
Interleave
Delay
/
Depth
,
INP
,
Bitswap
,
Trellis
,
Phy-R
, and
G.INP
.
DSL Statistics
include
DSL Counters
, transfer mode statistics including
KL0
and
EWL
,
Rate Adaptation
, and
Vector State
with
Performance Counters
.
Band Information
includes Down/Upstream results for
SNR Margin
,
Loop
/
Signal Attenuation
,
Output Power
, and
KL0
.
Loop Diagnostics
displays Down/Upstream SNR/ATTN (HLog)/QLN/ALN per Tone results in graphical
format.
Data Tests Summary
displays results for Ping, Trace Route, FTP, and HTTP; and the enabled optional
data tests including VoIP, IPTV, Throughput, and
Web Browser
.
When
IPv6 (DHCP)
is set as the
Access Mode
in
Connection Setup
, only
Ping Test
is displayed.
Throughput Test
implements the
iPerf3
or
Ookla
1
tool for active measurements of the maximum
achievable bandwidth on IP networks.
Note:
Ookla Privacy Policy: http://www.speedtest.net/privacy
You, end user, understand and acknowledge, by performing the test contained in the
Speedtest Powered Software Application, that Ookla, LLC may collect your IP address during
the test and share it with selected third parties.
1.Ookla is a third party provider. The Ookla Speedtest Powered technology involves Ookla owned and/or controlled
servers that may or may not be within your network. Ookla retains the right to aggregate test results and to monetize
aggregated results as they see fit.
From the
Select Tests
tab,
Enable
/
Disable
the optional sub-tests. When
Access Mode
is set to
IPv6 (DHCP)
,
Ping
is the only test available.
Select the
Test Setup
tab to configure the following sub-tests (when
highlighted):
VoIP Test
,
IPTV Test
,
Ping
,
FTP
,
HTTP, Throughput Test
,
Traceroute
,
Web Browser Test
.
5
6
1
2
2
1
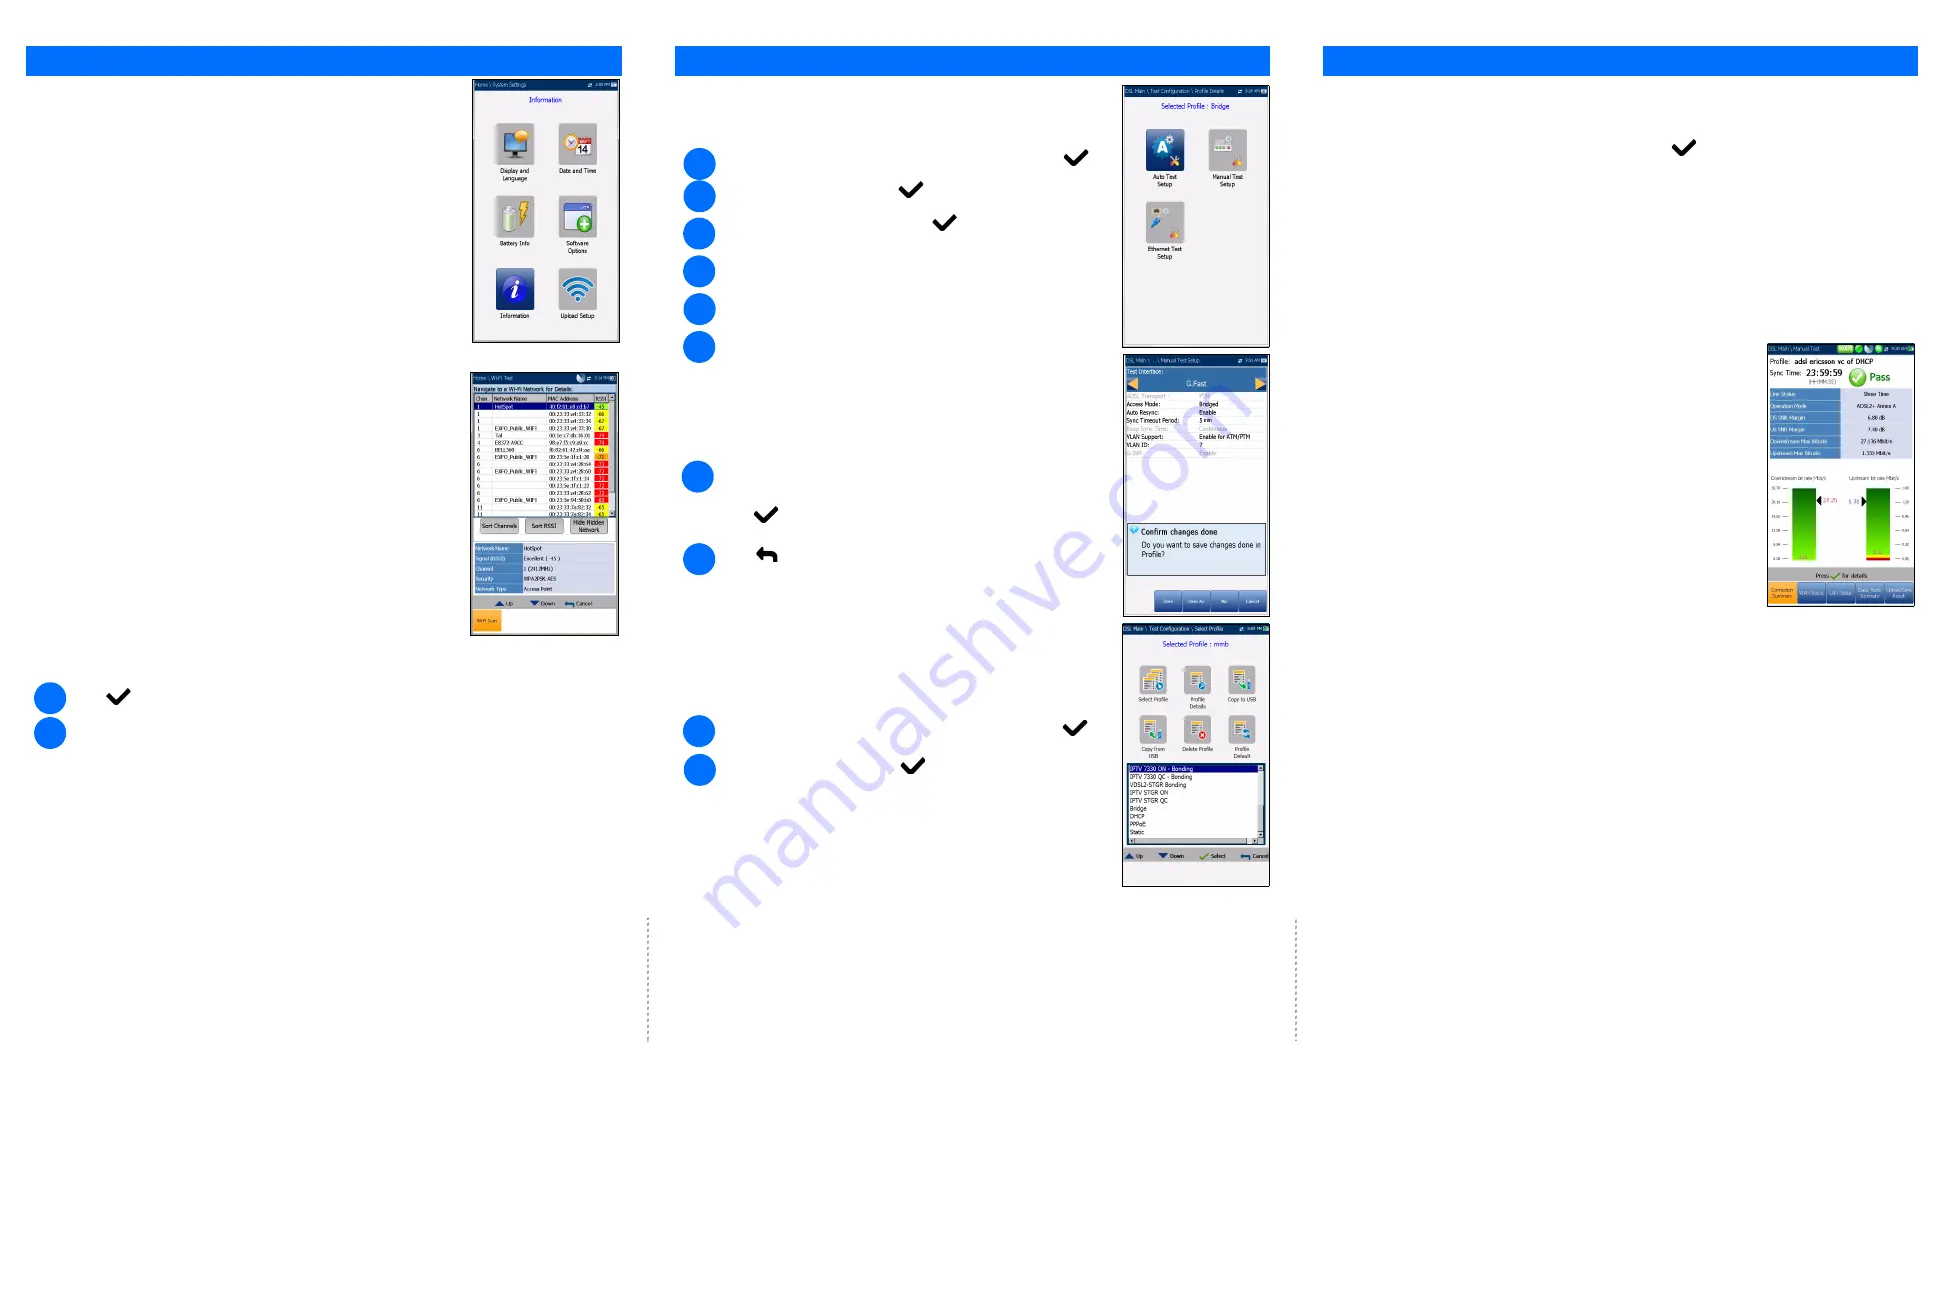
System Settings
Display and Language
provides the setup for backlight, information on the
title bar, language choice, and
Touchscreen Calibration
button if your unit
has the touchscreen option. The
Remote Display
tab allows you to connect
the MaxTester to your computer remotely.
Date and Time
also sets the date, time, their formats, and time zone.
Battery Info
displays battery status and power schemes including
Power
Save Mode
.
Software Options
lists all the
Configured Options
present on the unit.
Information
shows hardware/software/product information.
Upload Setup
allows you to enable in-band DSL FTP upload or select an
Out-band Upload Method
(Wi-Fi or Ethernet). Requires FTPUPLD option.
Wi-Fi Test
The
Wi-Fi Test
activates a Wi-Fi scan, listing all available wireless networks with
details for comparison. Details of the selected
Network Name
or SSID (service
set IDentifier), the name assigned to a wireless network, include the
Signal
(RSSI)
strength which displays one of the following levels with the table cell
shown in the corresponding colour:
No Signal (< -90/black)
Very Low (-90 to -82/red)
Low (-81 to -72/red)
Good (-71 to -68/orange)
Very Good (-67 to -58/yellow)
Excellent (> -58/green)
Use the
Sort Channels
/
RSSI
buttons to toggle the values by ascending and
descending.
Note:
With touchscreen, you can also sort the network names by
clicking/tapping the column header.
Press
to get into the list.
Press the up/down arrow keys to select a network and view its details below.
To navigate to a Wi-Fi network and view the details:
2
1


