Exinda Network Orchestrator
3 Using
|
183
NOTE
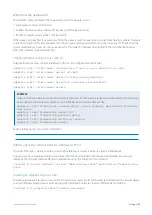
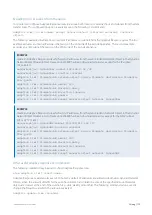
If no traffic matching this APS object is observed during the baseline period, the appliance restarts the baseline
analysis for the next larger time period. For example, if no traffic observed during the one hour period, the traffic
continues to be analyzed for one day. If no traffic is observed during the one day period, then the traffic is analyzed
for a week. If the traffic is analyzed for one week and no traffic has been transferred, the auto baseline analysis stops.
Each time the system unsuccessfully baselines the traffic (that is, when no traffic is observed during the auto
baseline period), an email notification is sent to the users configured on the
Configuration > System > Network >
page.
Related Topics
Creating an Application Performance Score object
Manually creating APS thresholds
How to know if baselining is in progress
How the Performance Metric thresholds are calculated
Checking if baselining is in progress
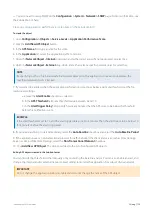
On the
Application Performance Score
configuration tab, the list of APS objects is shown. If the APS is currently
baselining the application traffic, there will be a green checkmark in the
Auto Baseline
column.
Press the
Edit
button for the APS object. The
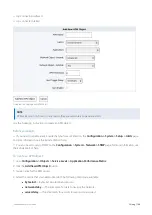
Baseline Info
section specifies the status (Running or Stopped) and the
Start and End Date and time of the baseline period. Note that it also shows the average packet size and the amount of
traffic seen.
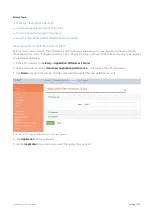
3.1.13 Configuring an application performance metric object
The Application Performance Metric (APM) objects are used to monitor particular application performance metrics. By
creating an APM object, you indicate which application to monitor. Optionally, you can also specify a network object so
that the application is only monitored when observed on that part of the network. You set a threshold on a single
network metric. Later, traffic for that application is assessed against that threshold to determine how well the application
is performing. An alert is triggered when the threshold is exceeded for a given length of time.
The following metrics are available:
bytes lost
network delay
server delay
transaction delay
normalized network delay
normalized server delay
normalized transaction delay
round trip time
tcp connections aborted
tcp connections ignored
Summary of Contents for EXNV-10063
Page 369: ...Exinda Network Orchestrator 4 Settings 369 ...
Page 411: ...Exinda Network Orchestrator 4 Settings 411 Screenshot 168 P2P OverflowVirtualCircuit ...
Page 420: ...Exinda Network Orchestrator 4 Settings 420 Screenshot 175 Students OverflowVirtualCircuit ...

