Exinda Network Orchestrator
3 Using
|
186
3.2.5 Monitoring service levels
3.2.7 Monitoring network users
3.2.8 Monitoring hosts traffic volume
3.2.9 Monitoring network conversations
3.2.11 Monitoring virtual circuits
3.2.12 Monitoring the effects of controls
3.2.13 Monitoring optimization reports
3.2.14 Monitoring Exinda Appliance system performance
3.2.1 Dashboards
The Exinda Web UI provides dashboards you can use to monitor the operation of an Exinda Appliance. One dashboard
displays system health and status information about the Exinda Appliance. The other dashboard provides statistical data
to show the benefits and impact of the Exinda Appliance in your network.
System dashboard
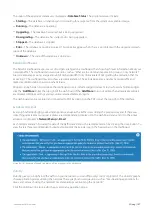
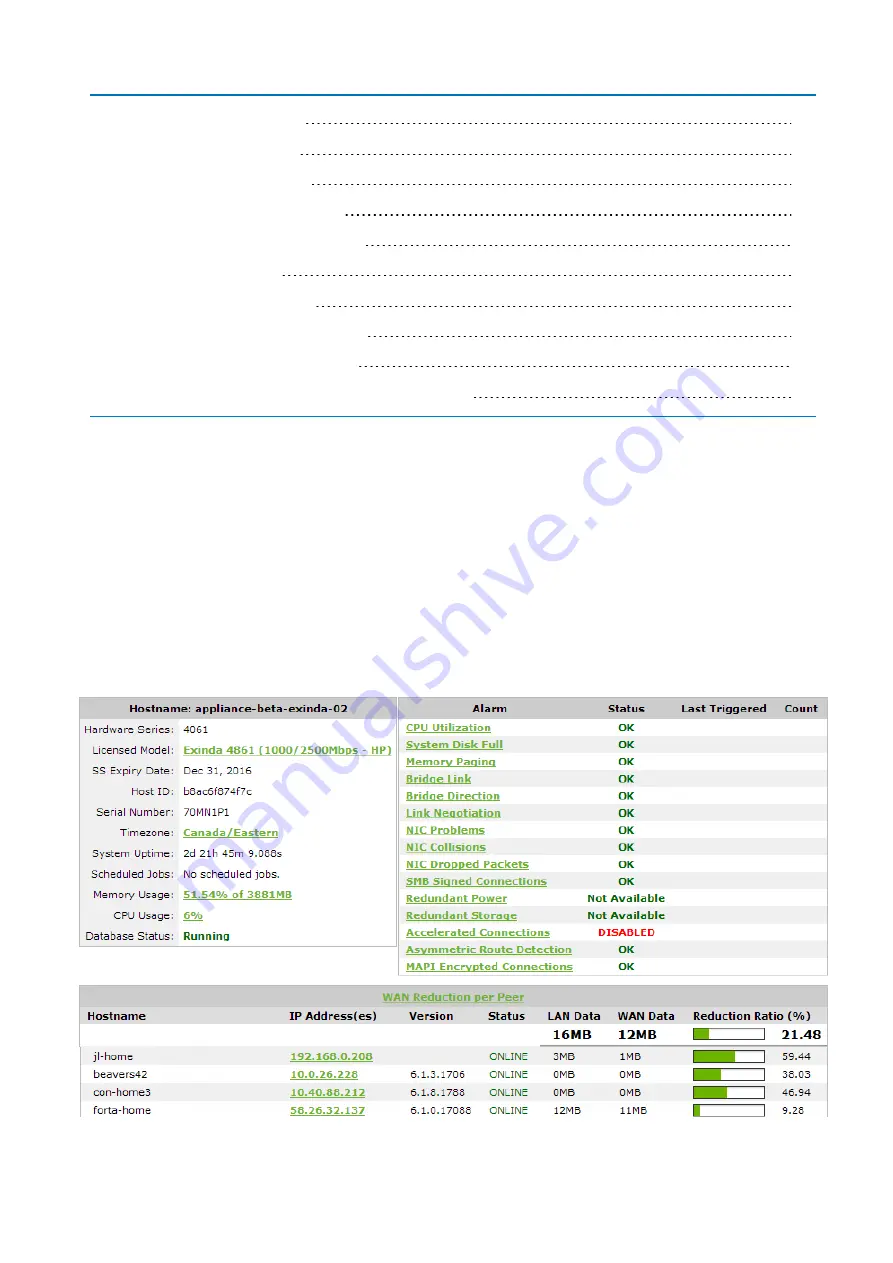
The System dashboard shows system information, the state of system alarms as well as a summary of other Exinda
appliances and their respective reduction statistics. The dashboard answers questions, such as "Are there any issues with
the NICs, or CPU utilization, or SMB signed connections, etc? What is this appliance licensed for? What is this appliance's
host ID? What is the reduction ratio between this appliance and others that it's accelerating with?"
Screenshot 66: The system dashboard displays information about an Exinda Appliance and its peers.
Summary of Contents for EXNV-10063
Page 369: ...Exinda Network Orchestrator 4 Settings 369 ...
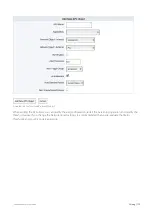
Page 411: ...Exinda Network Orchestrator 4 Settings 411 Screenshot 168 P2P OverflowVirtualCircuit ...
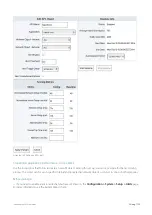
Page 420: ...Exinda Network Orchestrator 4 Settings 420 Screenshot 175 Students OverflowVirtualCircuit ...

