Exinda Network Orchestrator
3 Using
|
197
Monitoring application response in real time
The Realtime Application Response monitor shows the slowest applications by round-trip-time observed by the Exinda
Appliance during the last 10 seconds.
This report can answer questions such as:
Which applications may be having problems?
What are my poorest performing applications?
Why is the application performing poorly; could it be due to network delay or server delay?
To access this report, go to
Monitor > Real Time > Application Response
.
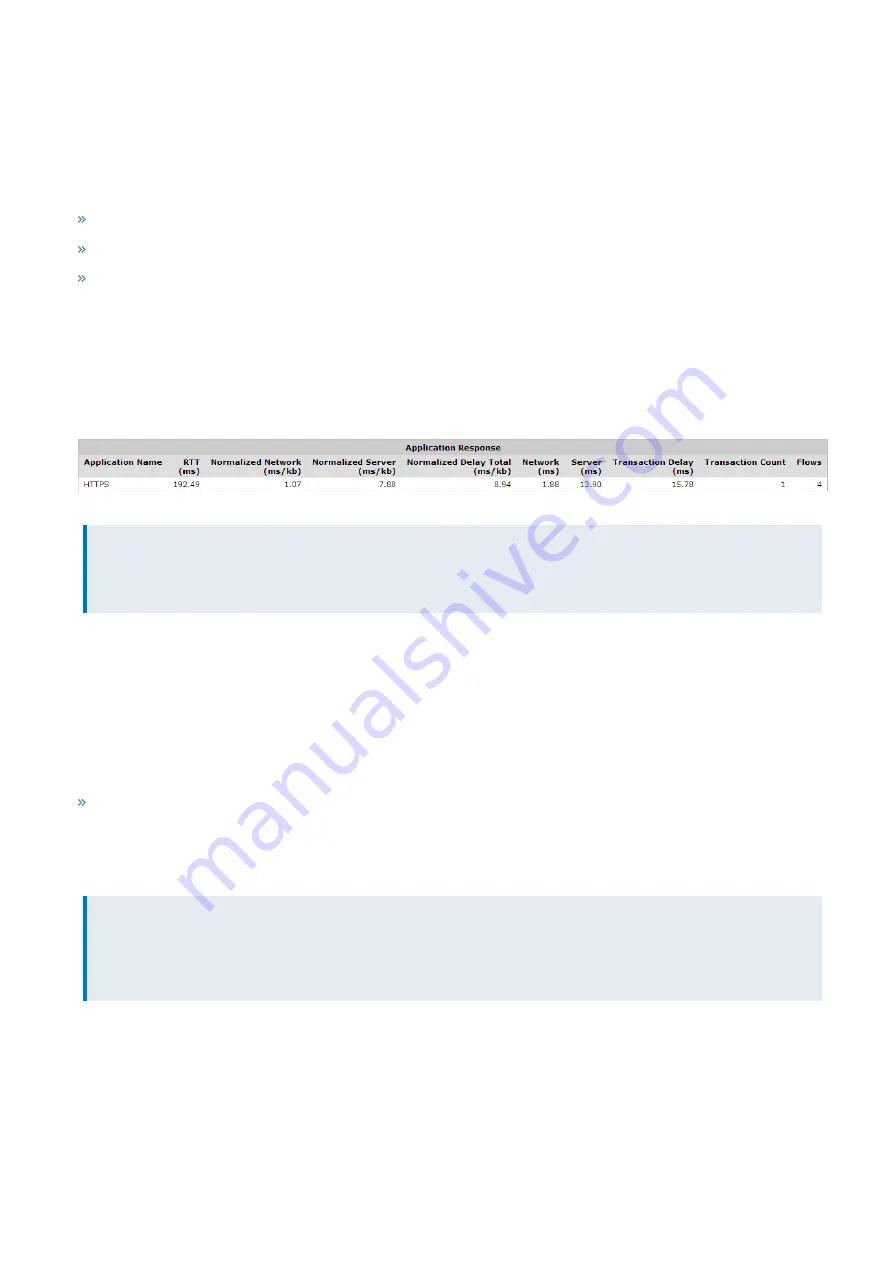
The monitor shows application response metrics like round-trip time (RTT), normalized network delay, normalized server
delay, normalized total delay, network delay, server delay, transaction delay, transaction count, and flow count by
application. Traffic is sorted by round-trip-time.
You can set the chart to refresh frequently or infrequently or not at all. Each refresh shows 10 seconds of data.
Screenshot 73: The Application Response monitor displays response by RTT.
NOTE
These statistics are only available if the Performance Metrics ASAM Module is enabled on the
page.
Related topic
Monitor the real time application response
Monitoring host health in real time
The Realtime Host Health monitor shows unhealthy hosts as measured by the number of retransmitted bytes during the
last 10 seconds. This report answers questions such as:
Which internal hosts are having the most difficulty with successfully transmitting traffic?
The monitor separates internal and external hosts and displays metrics like number of retransmitted bytes, number of
aborted connections, number of refused connections, number of ignored connections, and the flow count for each
internal and external host monitored during the last 10 seconds.
NOTE
A new internal mechanism was implemented in the ExOS 7.4.2 firmware that prevents Exinda Appliances from
being affected by DDoS attacks. As a consequence, the “Ignored Connections” historical report is no longer
available, but the Realtime Health report includes the number of ignored connections.
Traffic is sorted by the amount of retransmitted bytes. You can set the chart to refresh frequently or infrequently or not at
all. Each refresh shows 10 seconds of data.
Summary of Contents for EXNV-10063
Page 369: ...Exinda Network Orchestrator 4 Settings 369 ...
Page 411: ...Exinda Network Orchestrator 4 Settings 411 Screenshot 168 P2P OverflowVirtualCircuit ...
Page 420: ...Exinda Network Orchestrator 4 Settings 420 Screenshot 175 Students OverflowVirtualCircuit ...


