Exinda Network Orchestrator
3 Using
|
206
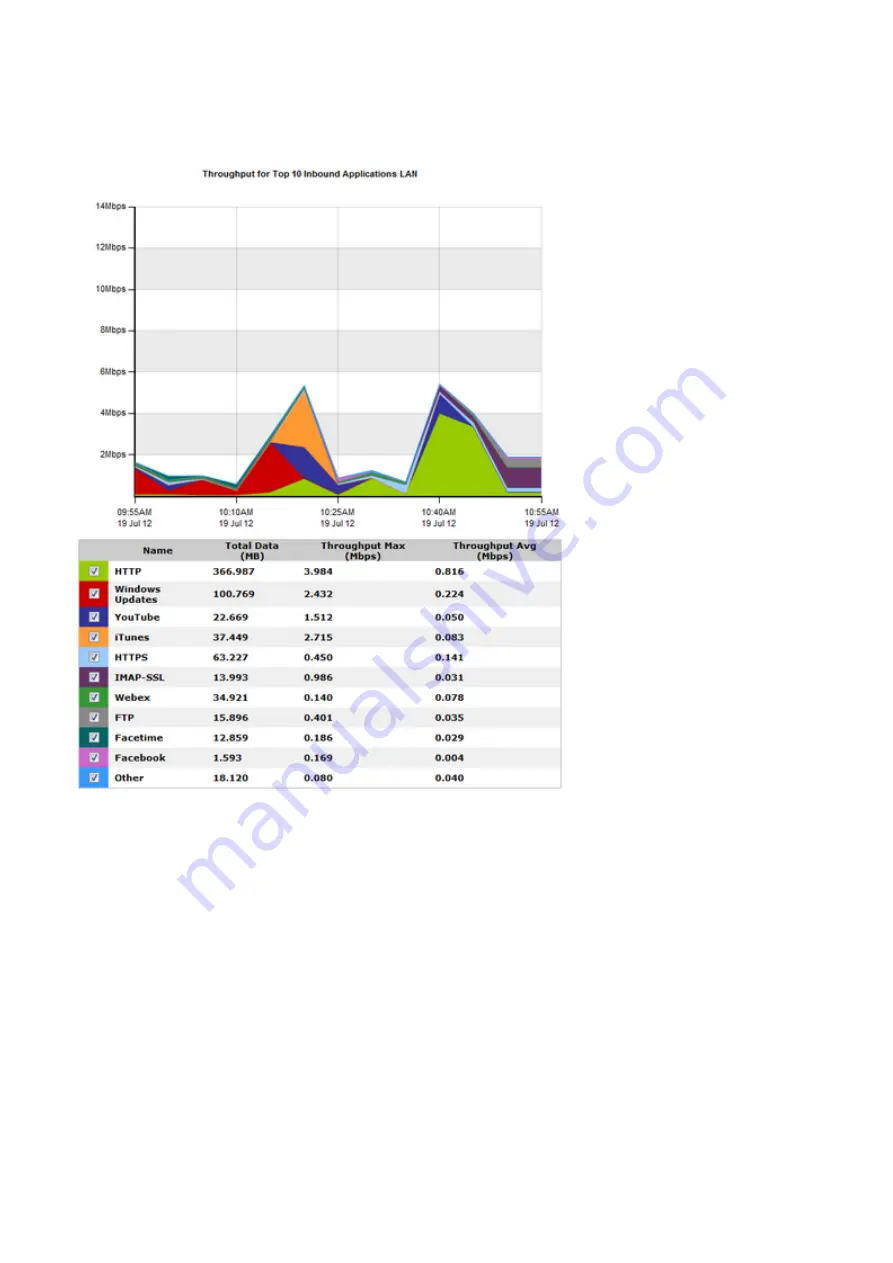
The report shows LAN-side and WAN-side charts for both inbound traffic and outbound traffic. The total data volume,
maximum throughput, and average throughput is also shown in tables below each chart. The charts aggregate data
outside the top 10 in a category named "Other".
Screenshot 78: The Network Summary report displays LAN traffic volume for the top 10 inbound applications.
Where do I find this report?
Go to
Monitor > Network
.
To determine the right size of your network (i.e. remove items from the chart)
Remove specific types of traffic from the graph by deselecting their checkbox in the legend below the graph. The
remaining traffic models what your network traffic would look like if you blocked that type of traffic. You can then
determine an appropriate amount of bandwidth required.
To identify which throughput falls above a specific percentile
Select the desired percentile level from the
Select Percentile Marker to Display
selector.
Summary of Contents for EXNV-10063
Page 369: ...Exinda Network Orchestrator 4 Settings 369 ...
Page 411: ...Exinda Network Orchestrator 4 Settings 411 Screenshot 168 P2P OverflowVirtualCircuit ...
Page 420: ...Exinda Network Orchestrator 4 Settings 420 Screenshot 175 Students OverflowVirtualCircuit ...


