Exinda Network Orchestrator
3 Using
|
207
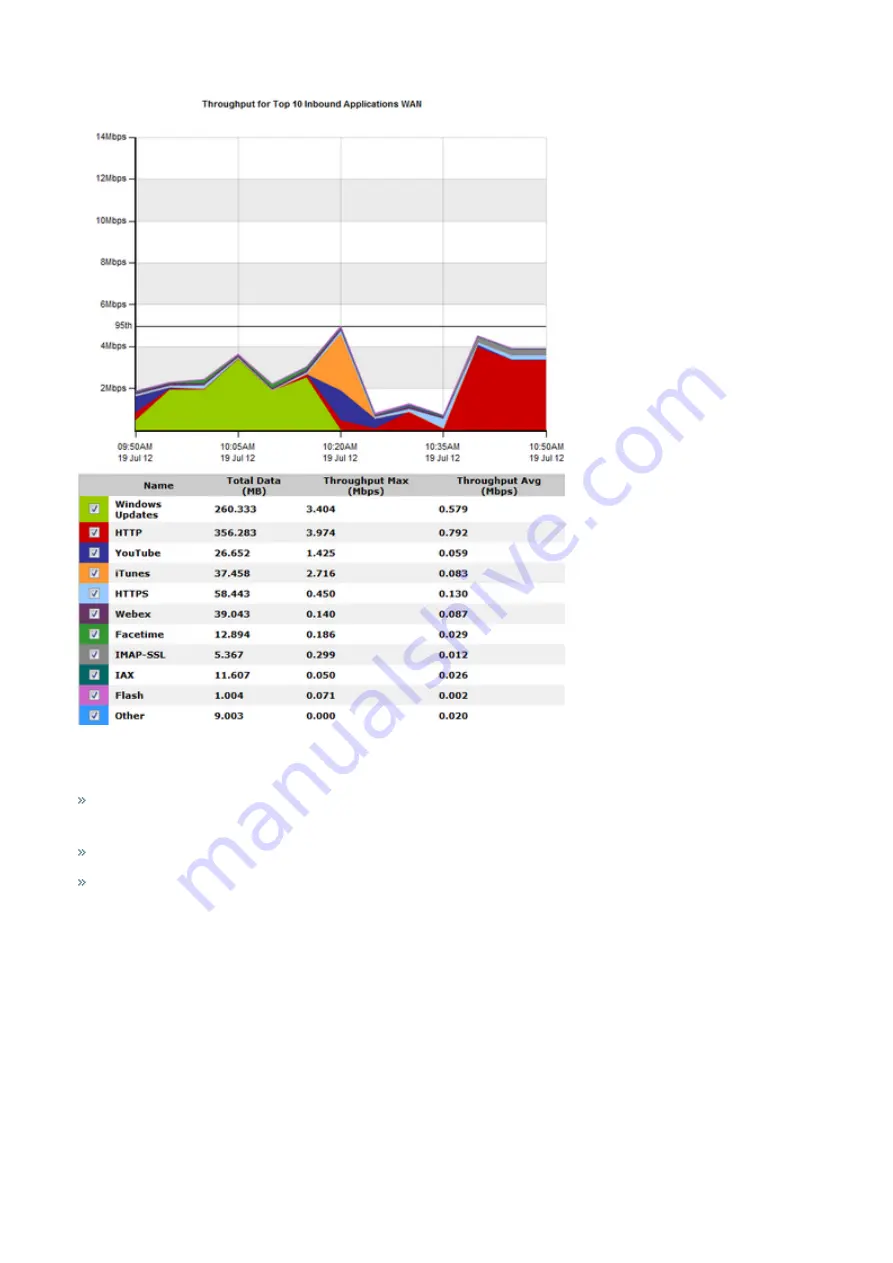
Screenshot 79: The Network Summary report displays WAN traffic volume for the top 10 inbound applications.
How do I interact with the interactive flash time graphs?
To understand how to get a better look at traffic patterns and to remove clutter on the time graph, see
To understand how to set the desired time range for a chart, see
To understand how to print the report or schedule the report, see
Printing and Scheduling Reports
.
3.2.5 Monitoring service levels
Learn how to view application performance reports, the availability of your ISP, and the health and efficiency of TCP
traffic.
Monitoring application performance scores
The Application Performance Score (APS) report shows scores that assess network performance and user experience
when using business-critical applications.
These charts can answer questions such as:
Summary of Contents for EXNV-10063
Page 369: ...Exinda Network Orchestrator 4 Settings 369 ...
Page 411: ...Exinda Network Orchestrator 4 Settings 411 Screenshot 168 P2P OverflowVirtualCircuit ...
Page 420: ...Exinda Network Orchestrator 4 Settings 420 Screenshot 175 Students OverflowVirtualCircuit ...


