Exinda Network Orchestrator
3 Using
|
219
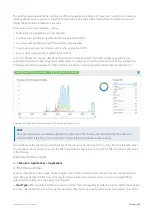
To understand how to set the desired time range for a chart, see
To understand how to drill into the data to find particular filtered data, see
To understand how to print the report or schedule the report, see
Printing and Scheduling Reports
.
Related topic
View a network summary of application groups
Viewing a network summary of application groups
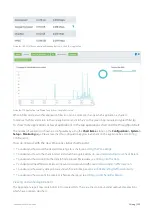
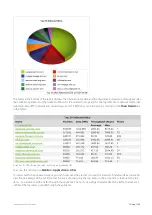
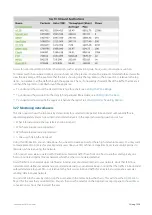
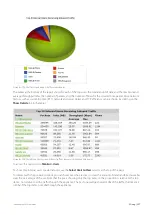
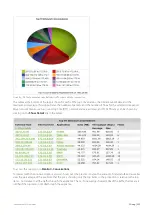
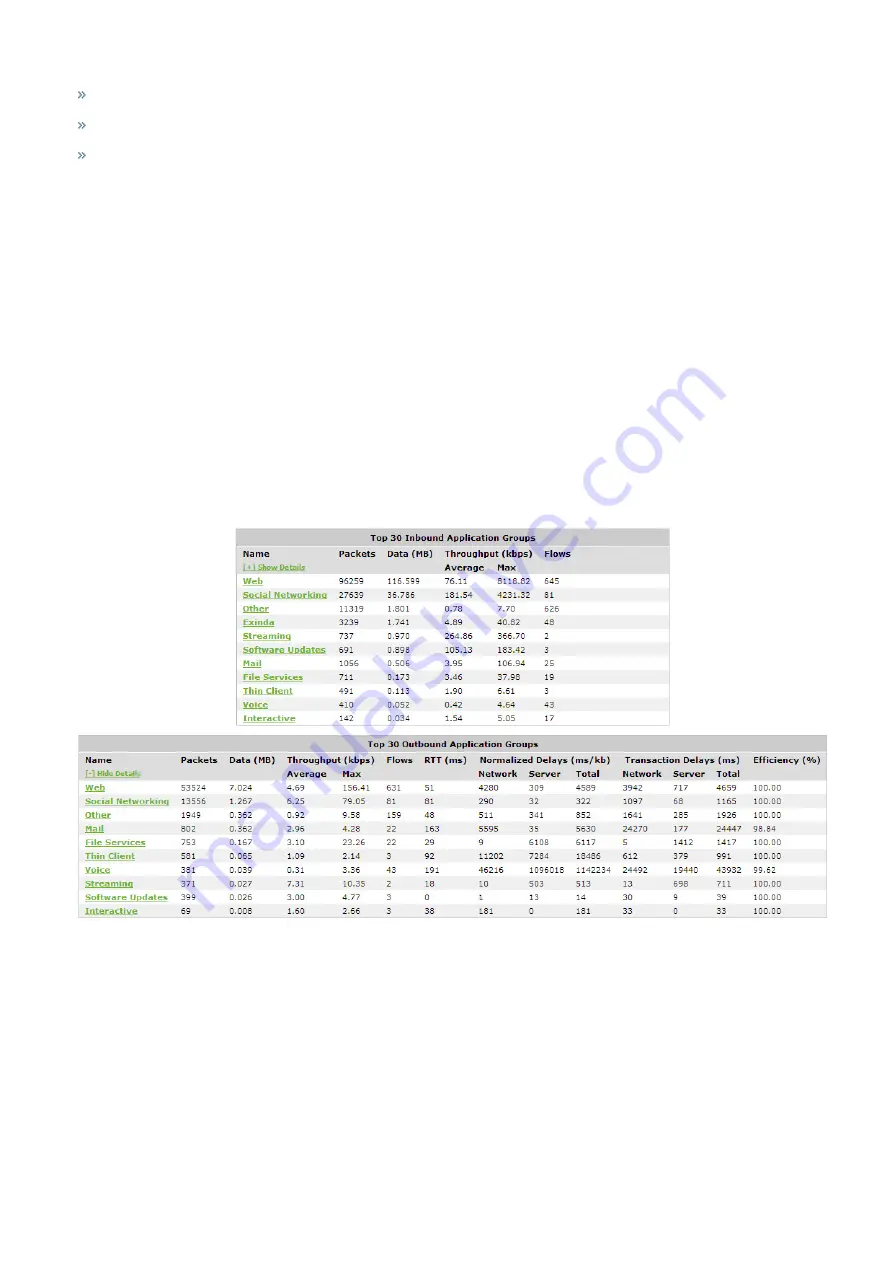
Each table shows the top application groups together with the number of packets, number of flows data transferred and
throughput statistics.
1.
On your browser, open the Exinda Web UI (
https://UI_IP_address
).
2.
Key-in the
User Name
and
Password
.
3.
Click
Login
. The Exinda Web UI appears.
5.
Click
Monitor > Application Groups
and switch to the
Groups
tab.
6.
To expose Round trip time, Normalized Delays, Transaction Delays, and Efficiency statistics for each Application Group,
click
Show Details
.
7.
To view the data for individual applications within a group, click the application group name.
Viewing application traffic volume
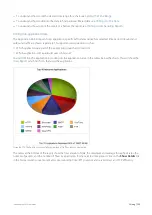
The Applications report shows the top applications by volume and their average throughput. Volume and throughput
data for single applications can be graphed by clicking the filter icon for the desired application in the data table below
the graphs. Inbound and outbound LAN application traffic is reported separately.
To show all application traffic, add a category to represent the remaining application traffic on your network. Doing this
allows the cumulative stack on the throughput chart to represent all the application traffic moving through the
appliance.
Summary of Contents for EXNV-10063
Page 369: ...Exinda Network Orchestrator 4 Settings 369 ...
Page 411: ...Exinda Network Orchestrator 4 Settings 411 Screenshot 168 P2P OverflowVirtualCircuit ...
Page 420: ...Exinda Network Orchestrator 4 Settings 420 Screenshot 175 Students OverflowVirtualCircuit ...


